79 Castle Ridge Dr Unit 40 East Hanover, NJ 07936
Estimated Value: $594,239 - $663,000
--
Bed
--
Bath
2,216
Sq Ft
$286/Sq Ft
Est. Value
About This Home
This home is located at 79 Castle Ridge Dr Unit 40, East Hanover, NJ 07936 and is currently estimated at $633,310, approximately $285 per square foot. 79 Castle Ridge Dr Unit 40 is a home located in Morris County with nearby schools including Frank J. Smith Elementary School, Central Elementary School, and East Hanover Middle School.
Ownership History
Date
Name
Owned For
Owner Type
Purchase Details
Closed on
May 18, 2016
Sold by
Zuchowksi Sabrina and Marra Giovanni
Bought by
Zuchowski Jeffry and Zuchowski Sabrfian
Current Estimated Value
Home Financials for this Owner
Home Financials are based on the most recent Mortgage that was taken out on this home.
Original Mortgage
$484,000
Outstanding Balance
$300,407
Interest Rate
3.58%
Mortgage Type
New Conventional
Estimated Equity
$332,903
Purchase Details
Closed on
Oct 15, 2010
Sold by
Cavallone Doris A and Cavallone John
Bought by
Zuchowski Sabrina and Marra Giovanni
Home Financials for this Owner
Home Financials are based on the most recent Mortgage that was taken out on this home.
Original Mortgage
$541,925
Interest Rate
4.25%
Mortgage Type
FHA
Purchase Details
Closed on
Nov 8, 2005
Sold by
Cavallone John
Bought by
Cavallone Doris A
Purchase Details
Closed on
Nov 6, 1995
Sold by
Didomenico Michael and Dulio Augustine
Bought by
Burgos Julio and Burgos Luz M
Create a Home Valuation Report for This Property
The Home Valuation Report is an in-depth analysis detailing your home's value as well as a comparison with similar homes in the area
Home Values in the Area
Average Home Value in this Area
Purchase History
| Date | Buyer | Sale Price | Title Company |
|---|---|---|---|
| Zuchowski Jeffry | -- | Safe Land Title Agency Llc | |
| Zuchowski Sabrina | $590,000 | Multiple | |
| Cavallone Doris A | -- | -- | |
| Burgos Julio | $174,500 | -- |
Source: Public Records
Mortgage History
| Date | Status | Borrower | Loan Amount |
|---|---|---|---|
| Open | Zuchowski Jeffry | $484,000 | |
| Previous Owner | Zuchowski Sabrina | $541,925 |
Source: Public Records
Tax History Compared to Growth
Tax History
| Year | Tax Paid | Tax Assessment Tax Assessment Total Assessment is a certain percentage of the fair market value that is determined by local assessors to be the total taxable value of land and additions on the property. | Land | Improvement |
|---|---|---|---|---|
| 2025 | $7,022 | $270,700 | $109,300 | $161,400 |
| 2024 | $6,754 | $270,700 | $109,300 | $161,400 |
| 2023 | $17,728 | $675,600 | $201,300 | $474,300 |
| 2022 | $17,099 | $627,700 | $175,400 | $452,300 |
| 2021 | $17,099 | $602,500 | $169,700 | $432,800 |
| 2020 | $16,770 | $590,300 | $167,300 | $423,000 |
| 2019 | $16,493 | $578,100 | $162,500 | $415,600 |
| 2018 | $16,214 | $559,300 | $158,800 | $400,500 |
| 2017 | $18,008 | $576,800 | $161,600 | $415,200 |
| 2016 | $17,777 | $576,800 | $161,600 | $415,200 |
| 2015 | $17,650 | $576,800 | $161,600 | $415,200 |
| 2014 | $17,321 | $576,800 | $161,600 | $415,200 |
Source: Public Records
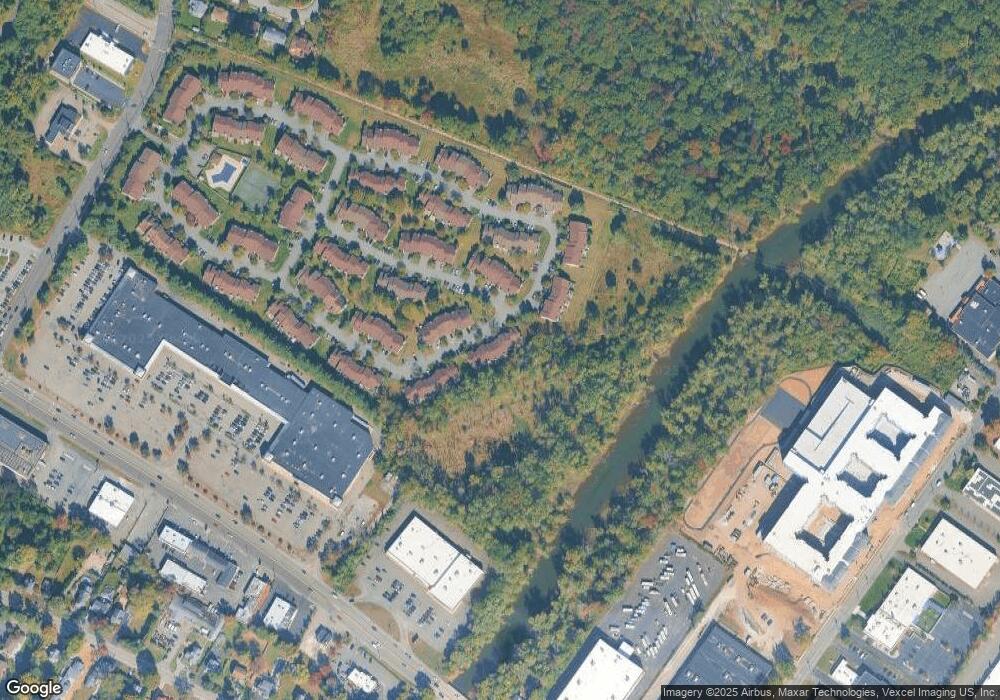
Map
Nearby Homes
- 50 River Rd
- 16 Claire Ct
- 29 Beach St
- 46 Eastwood Terrace Unit 55
- 7 Eastwood Terrace
- 32 Ridge Dr
- 4 Justin Dr
- 60 Baker Rd
- 83 Ventura Dr Unit 67
- 89 Ventura Dr
- 65 Eastwood Terrace
- 67 Eastwood Terrace
- 69 Eastwood Terrace
- 68 Eastwood Terrace
- Birch Plan at Valley View Park - The Signature Collection
- Pershing Plan at Valley View Park - The Pershing Collection
- Monterey Plan at Valley View Park - The Monterey Collection
- Maple Plan at Valley View Park - The Signature Collection
- 62 Eastwood Terrace
- 4 Eastwood Terrace
- 81 Castle Ridge Dr Unit 41
- 77 Castle Ridge Dr
- 83 Castle Ridge Dr
- 75 Castle Ridge Dr Unit 38
- 73 Castle Ridge Dr Unit 37
- 70 Castle Ridge Dr
- 68 Castle Ridge Dr Unit 131
- 71 Castle Ridge Dr
- 66 Castle Ridge Dr
- 85 Castle Ridge Dr Unit 43
- 36 Queensbridge Dr
- 69 Castle Ridge Dr Unit 35
- 64 Castle Ridge Dr
- 34 Queensbridge Dr
- 87 Castle Ridge Dr
- 62 Castle Ridge Dr
- 67 Castle Ridge Dr Unit 34
- 32 Queensbridge Dr Unit 163
- 60 Castle Ridge Dr
- 89 Castle Ridge Dr