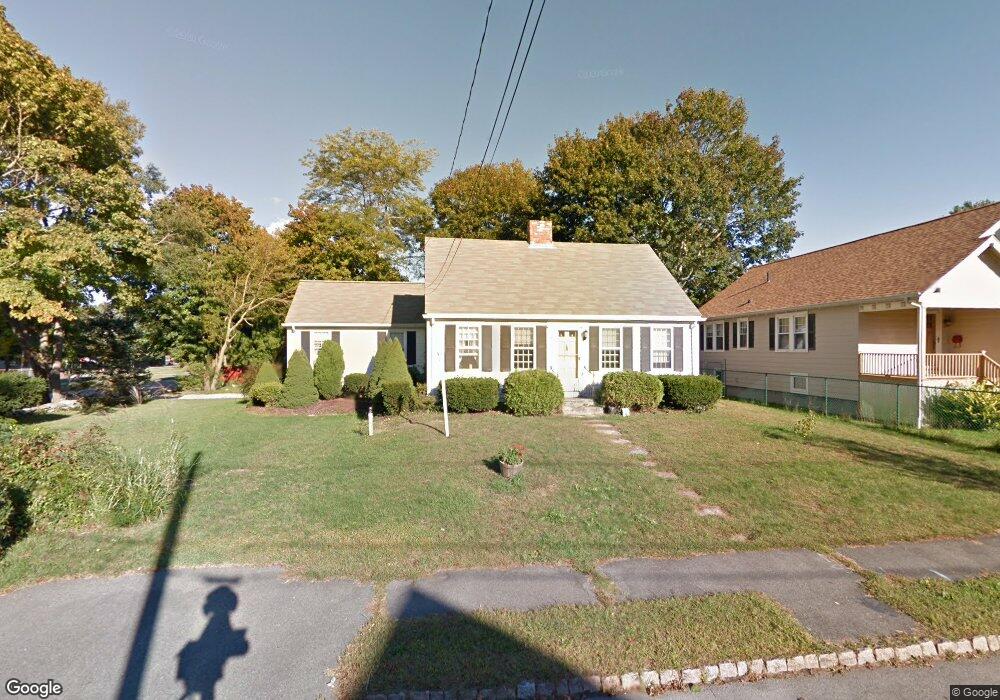
79 Chestnut St Fairhaven, MA 02719
Estimated Value: $632,000 - $685,000
2
Beds
3
Baths
1,951
Sq Ft
$335/Sq Ft
Est. Value
About This Home
This home is located at 79 Chestnut St, Fairhaven, MA 02719 and is currently estimated at $652,887, approximately $334 per square foot. 79 Chestnut St is a home located in Bristol County with nearby schools including Fairhaven High School, City On A Hill Charter Public School New Bedford, and St. Joseph School.
Ownership History
Date
Name
Owned For
Owner Type
Purchase Details
Closed on
Mar 2, 2022
Sold by
Ponte Steven F and Ponte Ann M
Bought by
Ponte Ft
Current Estimated Value
Purchase Details
Closed on
Jul 8, 1982
Bought by
Ponte Steven F and Ponte Ann M
Create a Home Valuation Report for This Property
The Home Valuation Report is an in-depth analysis detailing your home's value as well as a comparison with similar homes in the area
Home Values in the Area
Average Home Value in this Area
Purchase History
| Date | Buyer | Sale Price | Title Company |
|---|---|---|---|
| Ponte Ft | -- | None Available | |
| Ponte Steven F | $48,900 | -- |
Source: Public Records
Mortgage History
| Date | Status | Borrower | Loan Amount |
|---|---|---|---|
| Previous Owner | Ponte Steven F | $20,000 | |
| Previous Owner | Ponte Steven F | $69,000 | |
| Previous Owner | Ponte Steven F | $46,000 |
Source: Public Records
Tax History
| Year | Tax Paid | Tax Assessment Tax Assessment Total Assessment is a certain percentage of the fair market value that is determined by local assessors to be the total taxable value of land and additions on the property. | Land | Improvement |
|---|---|---|---|---|
| 2025 | $48 | $512,400 | $249,800 | $262,600 |
| 2024 | $4,576 | $495,800 | $249,800 | $246,000 |
| 2023 | $4,193 | $421,400 | $215,500 | $205,900 |
| 2022 | $4,021 | $393,400 | $196,300 | $197,100 |
| 2021 | $3,936 | $348,600 | $178,400 | $170,200 |
| 2020 | $3,856 | $348,600 | $178,400 | $170,200 |
| 2019 | $3,688 | $316,000 | $152,900 | $163,100 |
| 2018 | $3,486 | $300,600 | $145,500 | $155,100 |
| 2017 | $3,431 | $285,000 | $140,000 | $145,000 |
| 2016 | $3,393 | $278,600 | $137,200 | $141,400 |
| 2015 | $3,246 | $267,200 | $137,200 | $130,000 |
Source: Public Records
Map
Nearby Homes