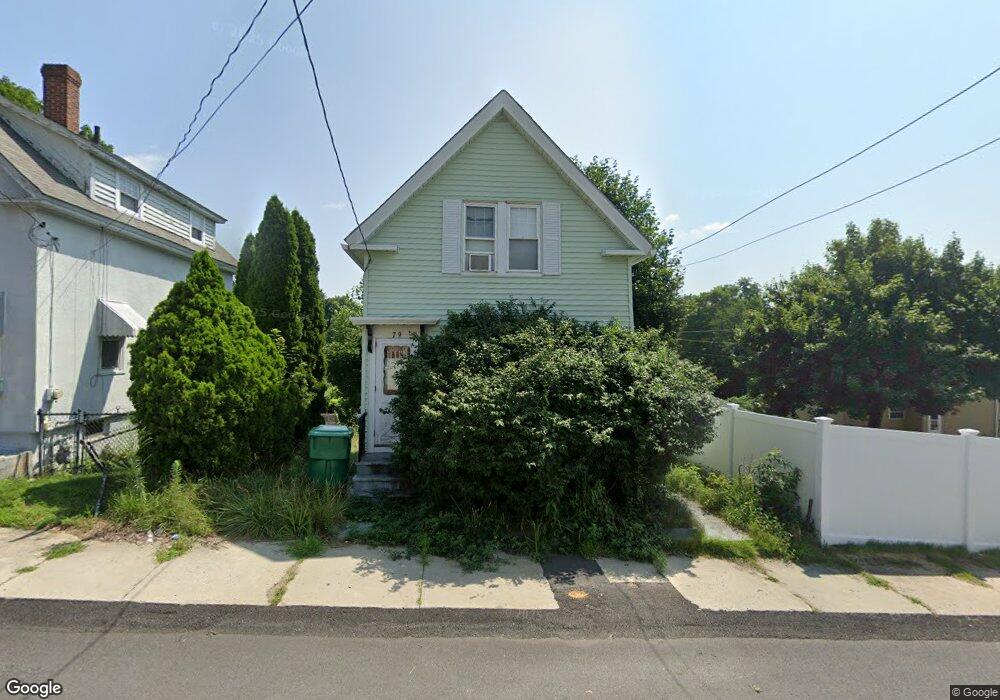
79 Clark St Clinton, MA 01510
Estimated Value: $319,109 - $367,000
3
Beds
1
Bath
734
Sq Ft
$470/Sq Ft
Est. Value
About This Home
This home is located at 79 Clark St, Clinton, MA 01510 and is currently estimated at $345,277, approximately $470 per square foot. 79 Clark St is a home located in Worcester County with nearby schools including Clinton Elementary School, Clinton Senior High School, and Clinton Middle School.
Ownership History
Date
Name
Owned For
Owner Type
Purchase Details
Closed on
Mar 31, 2003
Sold by
Clapp John D
Bought by
Brown Tracey A
Current Estimated Value
Home Financials for this Owner
Home Financials are based on the most recent Mortgage that was taken out on this home.
Original Mortgage
$127,920
Outstanding Balance
$55,599
Interest Rate
5.91%
Mortgage Type
Purchase Money Mortgage
Estimated Equity
$289,678
Purchase Details
Closed on
Mar 27, 2000
Sold by
Burke Jennifer M and Burke James J
Bought by
Clapp John D
Purchase Details
Closed on
Oct 31, 1994
Sold by
Burzenski Joan and Burke Karen
Bought by
Burke James
Create a Home Valuation Report for This Property
The Home Valuation Report is an in-depth analysis detailing your home's value as well as a comparison with similar homes in the area
Home Values in the Area
Average Home Value in this Area
Purchase History
| Date | Buyer | Sale Price | Title Company |
|---|---|---|---|
| Brown Tracey A | $159,900 | -- | |
| Clapp John D | $98,000 | -- | |
| Burke James | $75,000 | -- |
Source: Public Records
Mortgage History
| Date | Status | Borrower | Loan Amount |
|---|---|---|---|
| Open | Burke James | $127,920 | |
| Closed | Burke James | $15,990 | |
| Previous Owner | Burke James | $124,000 |
Source: Public Records
Tax History
| Year | Tax Paid | Tax Assessment Tax Assessment Total Assessment is a certain percentage of the fair market value that is determined by local assessors to be the total taxable value of land and additions on the property. | Land | Improvement |
|---|---|---|---|---|
| 2025 | $3,748 | $281,800 | $95,400 | $186,400 |
| 2024 | $3,359 | $255,600 | $95,400 | $160,200 |
| 2023 | $3,141 | $234,900 | $86,700 | $148,200 |
| 2022 | $3,131 | $210,000 | $78,800 | $131,200 |
| 2021 | $2,853 | $179,000 | $75,100 | $103,900 |
| 2020 | $2,773 | $179,000 | $75,100 | $103,900 |
| 2019 | $2,501 | $157,000 | $72,900 | $84,100 |
| 2018 | $2,622 | $154,400 | $72,900 | $81,500 |
| 2017 | $2,361 | $133,600 | $72,900 | $60,700 |
| 2016 | $2,380 | $137,800 | $72,900 | $64,900 |
| 2015 | $2,137 | $128,300 | $70,700 | $57,600 |
| 2014 | $2,072 | $128,300 | $70,700 | $57,600 |
Source: Public Records
Map
Nearby Homes
- 57 Clark St
- 719 Main St
- 459 High St
- 55 Sterling St Unit 306
- 55 Sterling St Unit 312
- 55 Sterling St Unit 314
- 55 Sterling St Unit 212
- 25 Pearl St
- 508 High St
- 861 Main St
- 93 Forest St
- 23 Ash St
- 30 Henry St Unit 30B
- 229 Sterling St
- 5 Catherine St
- 155 Cedar St
- 51 Rigby St
- 115117 Mechanic St Unit 4
- 115117 Mechanic St Unit 3
- 355 Main St
Your Personal Tour Guide
Ask me questions while you tour the home.