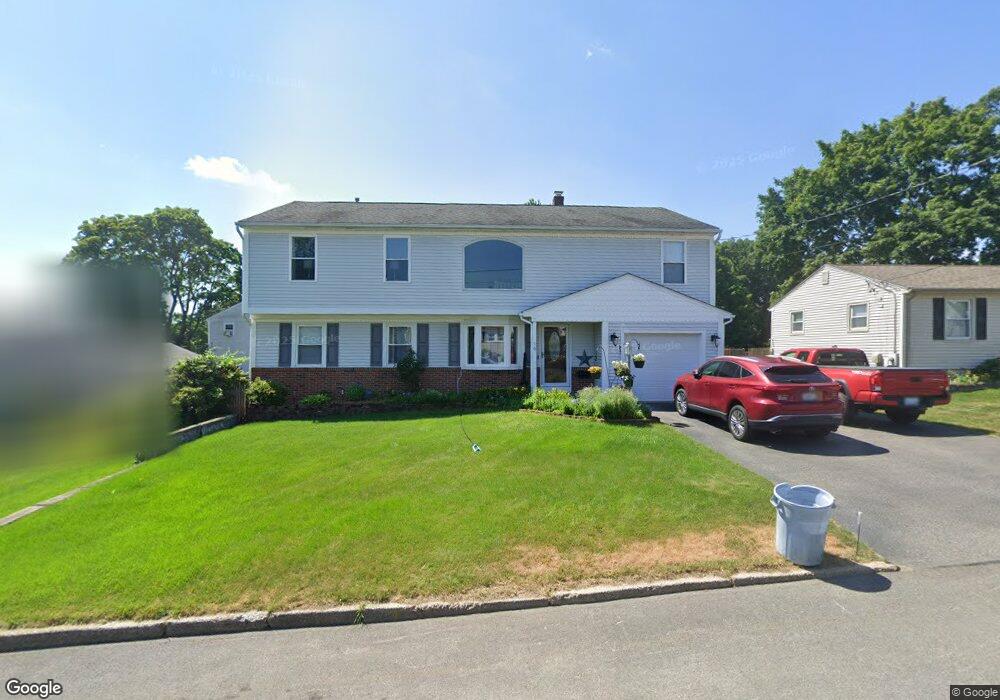
79 Crest Dr Pawtucket, RI 02861
Darlington NeighborhoodEstimated Value: $499,568 - $693,000
5
Beds
3
Baths
2,592
Sq Ft
$225/Sq Ft
Est. Value
About This Home
This home is located at 79 Crest Dr, Pawtucket, RI 02861 and is currently estimated at $584,142, approximately $225 per square foot. 79 Crest Dr is a home located in Providence County with nearby schools including St Cecilia School and Dayspring Christian Academy.
Ownership History
Date
Name
Owned For
Owner Type
Purchase Details
Closed on
Nov 6, 1991
Sold by
Spaziano Peter A
Bought by
Pereira Joseph C
Current Estimated Value
Home Financials for this Owner
Home Financials are based on the most recent Mortgage that was taken out on this home.
Original Mortgage
$70,000
Interest Rate
8.85%
Create a Home Valuation Report for This Property
The Home Valuation Report is an in-depth analysis detailing your home's value as well as a comparison with similar homes in the area
Home Values in the Area
Average Home Value in this Area
Purchase History
| Date | Buyer | Sale Price | Title Company |
|---|---|---|---|
| Pereira Joseph C | $120,000 | -- |
Source: Public Records
Mortgage History
| Date | Status | Borrower | Loan Amount |
|---|---|---|---|
| Open | Pereira Joseph C | $130,000 | |
| Closed | Pereira Joseph C | $105,000 | |
| Closed | Pereira Joseph C | $150,000 | |
| Closed | Pereira Joseph C | $70,000 |
Source: Public Records
Tax History
| Year | Tax Paid | Tax Assessment Tax Assessment Total Assessment is a certain percentage of the fair market value that is determined by local assessors to be the total taxable value of land and additions on the property. | Land | Improvement |
|---|---|---|---|---|
| 2025 | $5,781 | $439,600 | $165,100 | $274,500 |
| 2024 | $5,425 | $439,600 | $165,100 | $274,500 |
| 2023 | $6,273 | $370,300 | $102,700 | $267,600 |
| 2022 | $6,140 | $370,300 | $102,700 | $267,600 |
| 2021 | $6,140 | $370,300 | $102,700 | $267,600 |
| 2020 | $5,580 | $267,100 | $87,400 | $179,700 |
| 2019 | $5,580 | $267,100 | $87,400 | $179,700 |
| 2018 | $5,377 | $267,100 | $87,400 | $179,700 |
| 2017 | $5,778 | $254,300 | $92,500 | $161,800 |
| 2016 | $5,567 | $254,300 | $92,500 | $161,800 |
| 2015 | $5,829 | $266,300 | $92,500 | $173,800 |
| 2014 | $5,751 | $249,400 | $80,200 | $169,200 |
Source: Public Records
Map
Nearby Homes
- 70 Archer St
- 15 Don Ct
- 69 Clews St
- 13 Rita Dr
- 34 Elmcrest Dr
- 26 Blackburn St
- 56 Liberty Dr
- 1346 Newport Ave
- 1346 Newport Ave Unit B-21
- 49 Ames St
- 0 Cedar St
- 57 Cedarbrook Rd
- 65 Cedarbrook Rd
- 0 Perrin Ave
- 489 Benefit St
- 39 Clinton St
- 888 Central Ave
- 886 Central Ave
- 548 Kenyon Ave Unit 25
- 548 Kenyon Ave Unit 4
Your Personal Tour Guide
Ask me questions while you tour the home.