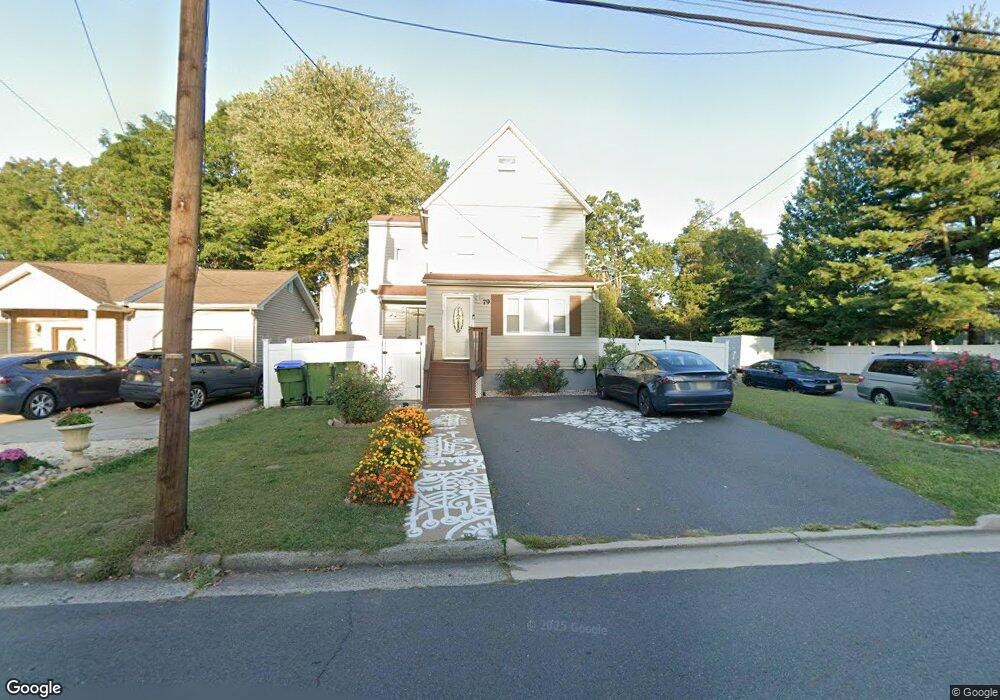
79 Crosby Ave Edison, NJ 08817
Estimated Value: $415,015 - $570,000
Studio
--
Bath
1,096
Sq Ft
$459/Sq Ft
Est. Value
About This Home
This home is located at 79 Crosby Ave, Edison, NJ 08817 and is currently estimated at $503,254, approximately $459 per square foot. 79 Crosby Ave is a home located in Middlesex County with nearby schools including Lindeneau Elementary School, Thomas Jefferson Middle School, and Edison High School.
Ownership History
Date
Name
Owned For
Owner Type
Purchase Details
Closed on
Oct 22, 2012
Sold by
Ahad Abdul and Neigher Sadeka M
Bought by
Ahad Abdul and Nigher Sadeka M
Current Estimated Value
Home Financials for this Owner
Home Financials are based on the most recent Mortgage that was taken out on this home.
Original Mortgage
$211,000
Outstanding Balance
$145,282
Interest Rate
3.39%
Mortgage Type
New Conventional
Estimated Equity
$357,972
Purchase Details
Closed on
Nov 20, 2003
Sold by
Gulotta Fred F
Bought by
Ahad Abdul and Neigher Sadeka M
Purchase Details
Closed on
Aug 16, 2000
Sold by
Gulotta Fred
Bought by
Chu Chung Yang and Chen Celine Hsiao Ching
Home Financials for this Owner
Home Financials are based on the most recent Mortgage that was taken out on this home.
Original Mortgage
$100,000
Interest Rate
8.06%
Create a Home Valuation Report for This Property
The Home Valuation Report is an in-depth analysis detailing your home's value as well as a comparison with similar homes in the area
Home Values in the Area
Average Home Value in this Area
Purchase History
| Date | Buyer | Sale Price | Title Company |
|---|---|---|---|
| Ahad Abdul | -- | None Available | |
| Ahad Abdul | $189,000 | -- | |
| Chu Chung Yang | $270,100 | -- |
Source: Public Records
Mortgage History
| Date | Status | Borrower | Loan Amount |
|---|---|---|---|
| Open | Ahad Abdul | $211,000 | |
| Previous Owner | Chu Chung Yang | $100,000 |
Source: Public Records
Tax History
| Year | Tax Paid | Tax Assessment Tax Assessment Total Assessment is a certain percentage of the fair market value that is determined by local assessors to be the total taxable value of land and additions on the property. | Land | Improvement |
|---|---|---|---|---|
| 2025 | $7,126 | $119,700 | $70,000 | $49,700 |
| 2024 | $7,087 | $119,700 | $70,000 | $49,700 |
Source: Public Records
Map
Nearby Homes
- 59 Oakland Ave
- 58 Fern St
- 65 Orange St
- 45 Loring Ave
- 61 Duley Ave
- 89 Hickory St
- 7 Vale St
- 1711 Central Ave
- 23 Morse Ave
- 111 Barnard St
- 9 Rolfe Ave
- 31 Highway Terrace
- 14 York Dr Unit 4B
- 6 York Dr Unit 5A
- 20 Clark Ave
- 226 Wellington Place
- 15 York Dr Unit 2A
- 15 York Dr Unit 1B
- 14 Amherst St
- 2 Clark Ave
Your Personal Tour Guide
Ask me questions while you tour the home.