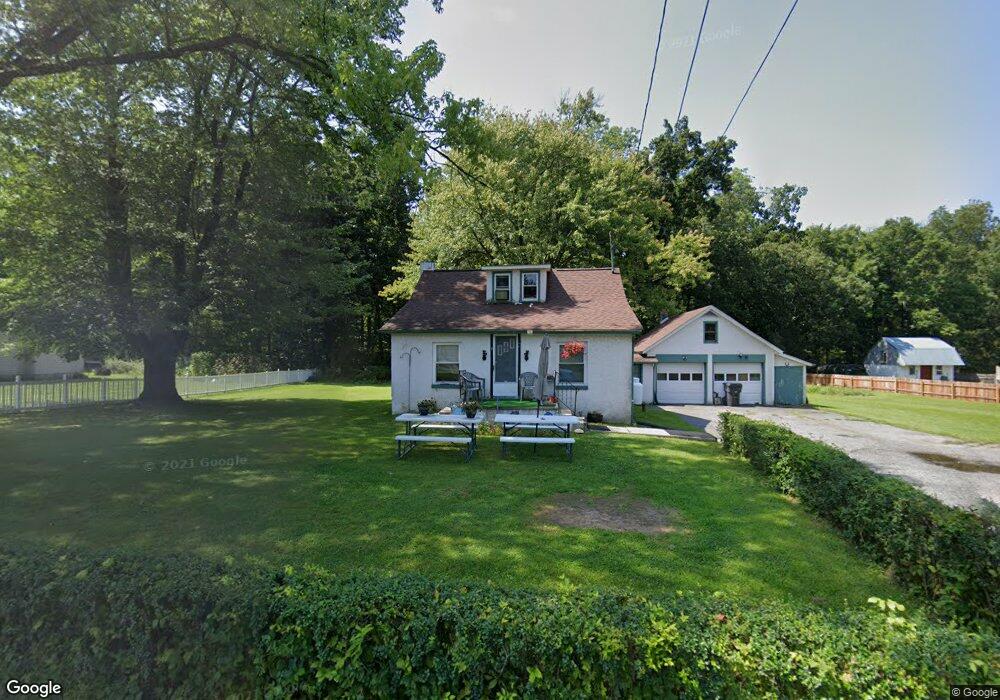
79 Cupola Rd Honey Brook, PA 19344
Estimated Value: $280,000 - $354,000
3
Beds
1
Bath
1,147
Sq Ft
$281/Sq Ft
Est. Value
About This Home
This home is located at 79 Cupola Rd, Honey Brook, PA 19344 and is currently estimated at $322,072, approximately $280 per square foot. 79 Cupola Rd is a home located in Chester County with nearby schools including Honey Brook Elementary Center, Twin Valley Middle School, and Twin Valley High School.
Ownership History
Date
Name
Owned For
Owner Type
Purchase Details
Closed on
Aug 14, 2023
Sold by
Charles R Blosenski R and Charles Janet L
Bought by
Charles R Blosenski Family Trust
Current Estimated Value
Purchase Details
Closed on
Aug 7, 1999
Sold by
Blosenski Charles R and Blosenski Janet
Bought by
Charles R Blosenski And Janet Blosenski Livin
Purchase Details
Closed on
Jul 7, 1999
Sold by
Souden Roy C and Blake Margaret E
Bought by
Blosenski Charles R and Blosenski Janet
Create a Home Valuation Report for This Property
The Home Valuation Report is an in-depth analysis detailing your home's value as well as a comparison with similar homes in the area
Home Values in the Area
Average Home Value in this Area
Purchase History
| Date | Buyer | Sale Price | Title Company |
|---|---|---|---|
| Charles R Blosenski Family Trust | -- | None Listed On Document | |
| Charles R Blosenski Family Trust | -- | None Listed On Document | |
| Charles R Blosenski And Janet Blosenski Livin | -- | None Listed On Document | |
| Blosenski Charles R | $80,000 | T A Title Insurance Company |
Source: Public Records
Tax History Compared to Growth
Tax History
| Year | Tax Paid | Tax Assessment Tax Assessment Total Assessment is a certain percentage of the fair market value that is determined by local assessors to be the total taxable value of land and additions on the property. | Land | Improvement |
|---|---|---|---|---|
| 2025 | $3,707 | $96,560 | $29,930 | $66,630 |
| 2024 | $3,707 | $96,560 | $29,930 | $66,630 |
| 2023 | $3,623 | $96,560 | $29,930 | $66,630 |
| 2022 | $3,583 | $96,560 | $29,930 | $66,630 |
| 2021 | $3,478 | $96,560 | $29,930 | $66,630 |
| 2020 | $3,461 | $96,560 | $29,930 | $66,630 |
| 2019 | $3,358 | $96,560 | $29,930 | $66,630 |
| 2018 | $3,358 | $96,560 | $29,930 | $66,630 |
| 2017 | $3,279 | $96,560 | $29,930 | $66,630 |
| 2016 | $2,718 | $96,560 | $29,930 | $66,630 |
| 2015 | $2,718 | $96,560 | $29,930 | $66,630 |
| 2014 | $2,718 | $96,560 | $29,930 | $66,630 |
Source: Public Records
Map
Nearby Homes