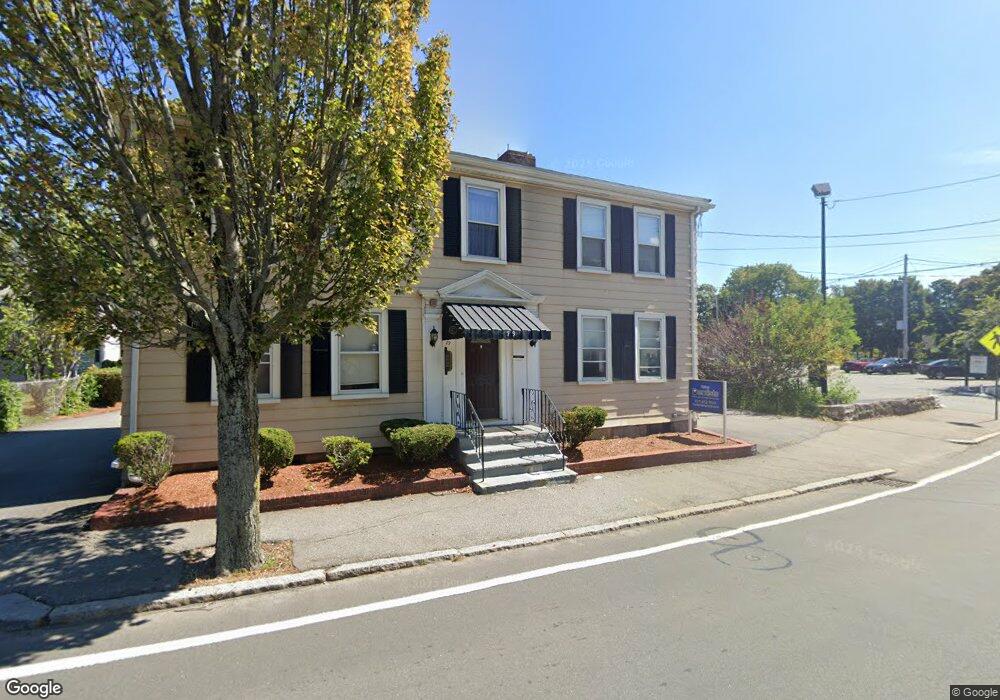
79 Elm St Quincy, MA 02169
Quincy Point NeighborhoodEstimated Value: $866,978
2
Beds
2
Baths
2,394
Sq Ft
$362/Sq Ft
Est. Value
About This Home
This home is located at 79 Elm St, Quincy, MA 02169 and is currently estimated at $866,978, approximately $362 per square foot. 79 Elm St is a home located in Norfolk County with nearby schools including Point Webster Middle School, Clifford H. Marshall Elementary School, and Quincy High School.
Ownership History
Date
Name
Owned For
Owner Type
Purchase Details
Closed on
Sep 2, 2016
Sold by
Angelini Domenic N
Bought by
Doctors Of Quincy Llc
Current Estimated Value
Home Financials for this Owner
Home Financials are based on the most recent Mortgage that was taken out on this home.
Original Mortgage
$420,000
Outstanding Balance
$335,695
Interest Rate
3.45%
Mortgage Type
Commercial
Estimated Equity
$531,283
Create a Home Valuation Report for This Property
The Home Valuation Report is an in-depth analysis detailing your home's value as well as a comparison with similar homes in the area
Home Values in the Area
Average Home Value in this Area
Purchase History
| Date | Buyer | Sale Price | Title Company |
|---|---|---|---|
| Doctors Of Quincy Llc | $500,000 | -- |
Source: Public Records
Mortgage History
| Date | Status | Borrower | Loan Amount |
|---|---|---|---|
| Open | Doctors Of Quincy Llc | $420,000 |
Source: Public Records
Tax History Compared to Growth
Tax History
| Year | Tax Paid | Tax Assessment Tax Assessment Total Assessment is a certain percentage of the fair market value that is determined by local assessors to be the total taxable value of land and additions on the property. | Land | Improvement |
|---|---|---|---|---|
| 2025 | -- | $603,000 | $221,200 | $381,800 |
| 2024 | -- | $578,200 | $219,000 | $359,200 |
| 2023 | $0 | $561,300 | $216,800 | $344,500 |
| 2022 | $0 | $502,600 | $206,500 | $296,100 |
| 2021 | $0 | $486,400 | $204,400 | $282,000 |
| 2020 | $0 | $471,000 | $202,400 | $268,600 |
| 2019 | $0 | $455,200 | $200,400 | $254,800 |
| 2018 | $0 | $455,300 | $198,400 | $256,900 |
| 2017 | $0 | $389,600 | $192,600 | $197,000 |
| 2016 | $8,202 | $389,100 | $192,600 | $196,500 |
| 2015 | $8,202 | $393,100 | $192,600 | $200,500 |
| 2014 | $8,202 | $383,600 | $192,600 | $191,000 |
Source: Public Records
Map
Nearby Homes
- 123 Elm St Unit D-8
- 34 South St Unit 202
- 5 Main St
- 36 Bigelow St
- 2 Cliveden St Unit 601E
- 2 Cliveden St Unit 305E
- 72 Main St
- 18 Cliveden St Unit 201W
- 57 Summer St
- 145 S Walnut St
- 32 Sumner St
- 35 Sumner St
- 51 Sumner St
- 215 Thomas Burgin Pkwy Unit 35
- 5 Pearl St
- 216 South St
- 195 Thomas Burgin Pkwy Unit 205
- 14 Harrington Ave
- 15 Vine Ave
- 161 Sumner St