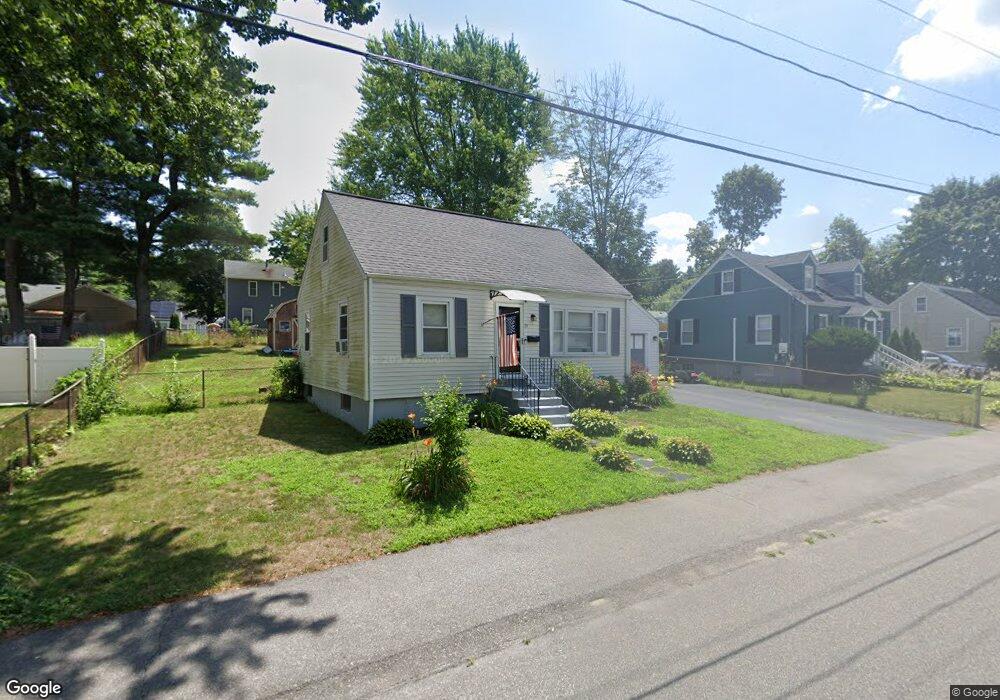
79 Ewing Dr Stoughton, MA 02072
Estimated Value: $476,000 - $515,000
3
Beds
1
Bath
1,008
Sq Ft
$486/Sq Ft
Est. Value
About This Home
This home is located at 79 Ewing Dr, Stoughton, MA 02072 and is currently estimated at $489,754, approximately $485 per square foot. 79 Ewing Dr is a home located in Norfolk County with nearby schools including Joseph R Dawe Jr Elementary School, O'Donnell Middle School, and Stoughton High School.
Ownership History
Date
Name
Owned For
Owner Type
Purchase Details
Closed on
May 21, 1999
Sold by
Terwilliger Ann M Est and Terwilliger
Bought by
Jackson Kevin S and Jackson Sharon N
Current Estimated Value
Home Financials for this Owner
Home Financials are based on the most recent Mortgage that was taken out on this home.
Original Mortgage
$152,572
Outstanding Balance
$38,900
Interest Rate
6.88%
Mortgage Type
Purchase Money Mortgage
Estimated Equity
$450,854
Create a Home Valuation Report for This Property
The Home Valuation Report is an in-depth analysis detailing your home's value as well as a comparison with similar homes in the area
Home Values in the Area
Average Home Value in this Area
Purchase History
| Date | Buyer | Sale Price | Title Company |
|---|---|---|---|
| Jackson Kevin S | $152,650 | -- |
Source: Public Records
Mortgage History
| Date | Status | Borrower | Loan Amount |
|---|---|---|---|
| Open | Jackson Kevin S | $152,572 |
Source: Public Records
Tax History
| Year | Tax Paid | Tax Assessment Tax Assessment Total Assessment is a certain percentage of the fair market value that is determined by local assessors to be the total taxable value of land and additions on the property. | Land | Improvement |
|---|---|---|---|---|
| 2025 | $5,087 | $410,900 | $203,800 | $207,100 |
| 2024 | $4,906 | $385,400 | $185,800 | $199,600 |
| 2023 | $4,783 | $353,000 | $172,600 | $180,400 |
| 2022 | $4,605 | $319,600 | $157,800 | $161,800 |
| 2021 | $4,414 | $292,300 | $143,000 | $149,300 |
| 2020 | $4,279 | $287,400 | $138,100 | $149,300 |
| 2019 | $4,252 | $277,200 | $138,100 | $139,100 |
| 2018 | $3,870 | $261,300 | $131,500 | $129,800 |
| 2017 | $3,489 | $240,800 | $124,900 | $115,900 |
| 2016 | $3,382 | $225,900 | $115,100 | $110,800 |
| 2015 | $3,318 | $219,300 | $108,500 | $110,800 |
| 2014 | $3,187 | $202,500 | $98,600 | $103,900 |
Source: Public Records
Map
Nearby Homes
- 32 Packard Rd
- 155 York St
- 36 Pleasant Dr Unit 42
- 122 York St
- 26 Faxon St Unit 2
- 58 Union St Unit 6
- 47 Trowbridge Cir
- 0 Washington St Unit 72888098
- 0 Washington St Unit 71897113
- 121 Bassick Cir
- 362 Lincoln St
- 11 Monk St
- 52 Adams St
- 15 Lawler Ln
- 25 Lawler Ln
- 30 Porter St
- 65 Station St
- 292 Prospect St
- 15-17 Morton Square
- Lot 43 Pondview Ln
Your Personal Tour Guide
Ask me questions while you tour the home.