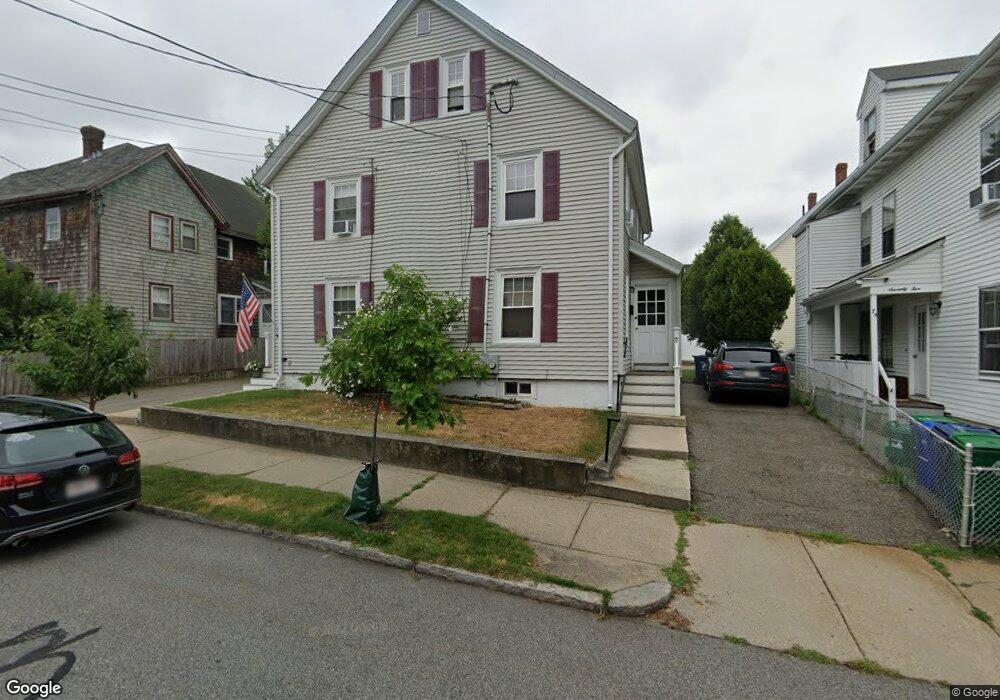
79 Faxon St Newton, MA 02458
Nonantum NeighborhoodEstimated Value: $683,000 - $948,000
3
Beds
2
Baths
1,216
Sq Ft
$630/Sq Ft
Est. Value
About This Home
This home is located at 79 Faxon St, Newton, MA 02458 and is currently estimated at $766,240, approximately $630 per square foot. 79 Faxon St is a home located in Middlesex County with nearby schools including Lincoln-Eliot Elementary School, Bigelow Middle School, and Newton North High School.
Ownership History
Date
Name
Owned For
Owner Type
Purchase Details
Closed on
Oct 15, 2008
Sold by
Hughes James P
Bought by
Morrison Cathleen and Morrison Scott
Current Estimated Value
Home Financials for this Owner
Home Financials are based on the most recent Mortgage that was taken out on this home.
Original Mortgage
$344,375
Outstanding Balance
$228,782
Interest Rate
6.41%
Mortgage Type
Purchase Money Mortgage
Estimated Equity
$537,458
Create a Home Valuation Report for This Property
The Home Valuation Report is an in-depth analysis detailing your home's value as well as a comparison with similar homes in the area
Home Values in the Area
Average Home Value in this Area
Purchase History
| Date | Buyer | Sale Price | Title Company |
|---|---|---|---|
| Morrison Cathleen | $362,000 | -- | |
| Morrison Cathleen | $362,000 | -- |
Source: Public Records
Mortgage History
| Date | Status | Borrower | Loan Amount |
|---|---|---|---|
| Open | Morrison Cathleen | $344,375 | |
| Closed | Morrison Cathleen | $344,375 |
Source: Public Records
Tax History Compared to Growth
Tax History
| Year | Tax Paid | Tax Assessment Tax Assessment Total Assessment is a certain percentage of the fair market value that is determined by local assessors to be the total taxable value of land and additions on the property. | Land | Improvement |
|---|---|---|---|---|
| 2025 | $5,660 | $577,600 | $0 | $577,600 |
| 2024 | $5,473 | $560,800 | $0 | $560,800 |
| 2023 | $5,362 | $526,700 | $0 | $526,700 |
| 2022 | $5,277 | $501,600 | $0 | $501,600 |
| 2021 | $5,092 | $473,200 | $0 | $473,200 |
| 2020 | $4,940 | $473,200 | $0 | $473,200 |
| 2019 | $4,801 | $459,400 | $0 | $459,400 |
| 2018 | $4,818 | $445,300 | $0 | $445,300 |
| 2017 | $4,672 | $420,100 | $0 | $420,100 |
| 2016 | $4,468 | $392,600 | $0 | $392,600 |
| 2015 | $4,341 | $373,900 | $0 | $373,900 |
Source: Public Records
Map
Nearby Homes
- 44 Faxon St Unit 2
- 290 Watertown St Unit 3
- 34 West St Unit A
- 53 West St
- 158 Adams St
- 68 Los Angeles St Unit PH5
- 188-190 Adams St
- 86 West St
- 11 Murphy Ct
- 49 Hawthorn St
- 77 Pond Ave Unit 1103
- 3 Ashmont Ave
- 12-14 Middle St
- 141 Morse St
- 290 Pleasant St Unit 220
- 290 Pleasant St Unit 113
- 338 Nevada St Unit 338
- 282 Nevada St Unit 282
- 286 Nevada St Unit 286
- 191 Linwood Ave
- 77 Faxon St
- 83 Faxon St Unit 85
- 83 Faxon St
- 73 Faxon St
- 73 Faxon St Unit 1
- 73 Jasset St
- 69 Faxon St Unit 1
- 89 Faxon St
- 70 Faxon St
- 61-63 Jasset St
- 86 Dalby St Unit 2
- 86 Dalby St Unit 1
- 61 Jasset St Unit 63
- 63 Jasset St
- 61 Jasset St
- 63 Jasset St Unit 1
- 61 Jasset St Unit 2
- 63 Faxon St
- 63 Faxon St Unit 65
- 93 Faxon St Unit 95