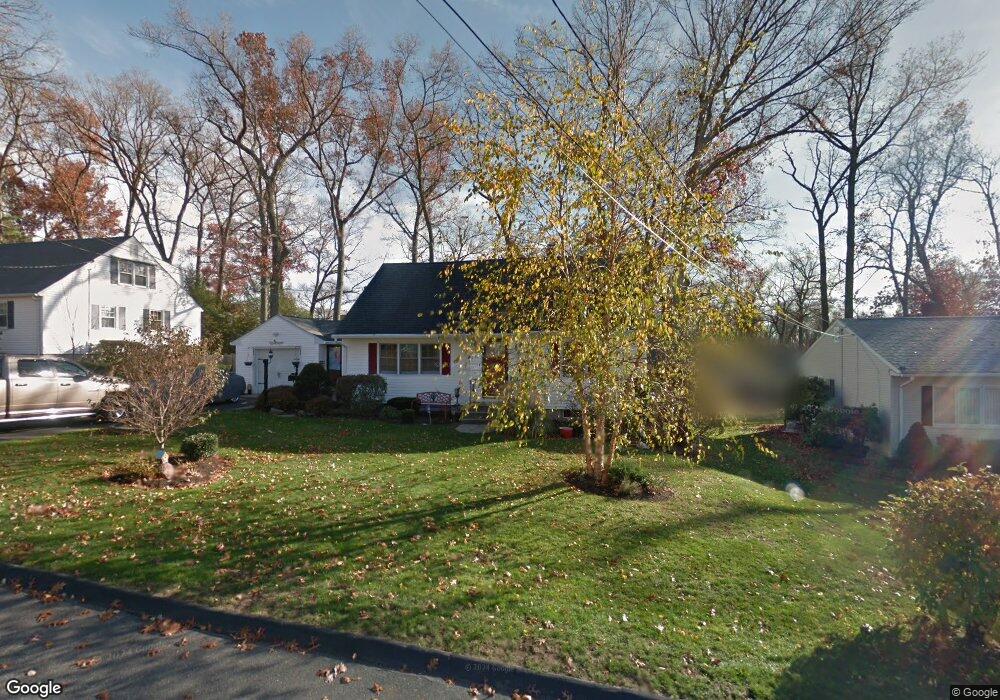
79 Hadley St Springfield, MA 01118
East Forest Park NeighborhoodEstimated Value: $332,000 - $422,000
4
Beds
2
Baths
1,800
Sq Ft
$202/Sq Ft
Est. Value
About This Home
This home is located at 79 Hadley St, Springfield, MA 01118 and is currently estimated at $362,901, approximately $201 per square foot. 79 Hadley St is a home located in Hampden County with nearby schools including Frederick Harris Elementary School, M Marcus Kiley Middle, and Springfield High School of Science and Technology.
Ownership History
Date
Name
Owned For
Owner Type
Purchase Details
Closed on
Feb 12, 2010
Sold by
Eagan John R
Bought by
Santiago Orlando and Santiago Ivia I
Current Estimated Value
Home Financials for this Owner
Home Financials are based on the most recent Mortgage that was taken out on this home.
Original Mortgage
$103,000
Outstanding Balance
$68,475
Interest Rate
5.12%
Mortgage Type
Purchase Money Mortgage
Estimated Equity
$294,426
Create a Home Valuation Report for This Property
The Home Valuation Report is an in-depth analysis detailing your home's value as well as a comparison with similar homes in the area
Home Values in the Area
Average Home Value in this Area
Purchase History
| Date | Buyer | Sale Price | Title Company |
|---|---|---|---|
| Santiago Orlando | $185,000 | -- |
Source: Public Records
Mortgage History
| Date | Status | Borrower | Loan Amount |
|---|---|---|---|
| Open | Santiago Orlando | $103,000 |
Source: Public Records
Tax History
| Year | Tax Paid | Tax Assessment Tax Assessment Total Assessment is a certain percentage of the fair market value that is determined by local assessors to be the total taxable value of land and additions on the property. | Land | Improvement |
|---|---|---|---|---|
| 2025 | $4,804 | $306,400 | $48,300 | $258,100 |
| 2024 | $4,868 | $303,100 | $48,300 | $254,800 |
| 2023 | $4,435 | $260,100 | $46,000 | $214,100 |
| 2022 | $4,404 | $234,000 | $46,000 | $188,000 |
| 2021 | $4,211 | $222,800 | $41,800 | $181,000 |
| 2020 | $3,929 | $201,200 | $41,800 | $159,400 |
| 2019 | $3,769 | $191,500 | $41,800 | $149,700 |
| 2018 | $3,592 | $182,500 | $41,800 | $140,700 |
| 2017 | $3,551 | $180,600 | $41,800 | $138,800 |
| 2016 | $3,439 | $174,900 | $41,800 | $133,100 |
| 2015 | $3,316 | $168,600 | $41,800 | $126,800 |
Source: Public Records
Map
Nearby Homes
- 46 Hadley St
- 206 Treetop Ave
- 125 Manor Ct Unit 125
- 116 Carr St
- 119 Powell Ave
- 19 Manor Ct Unit 19
- 17 Pebble Mill Rd
- 49 Corcoran Blvd
- 55 Allen St
- 13 Bither St
- 47 Hartford Terrace
- 1088 Sumner Ave
- 65 Helen Cir
- 48 Fairview St
- 161 Dorset St
- 78 Wood Ave
- 26 Dwight Rd
- 86 Talmadge Dr
- 29 Eddywood St
- 79 Roosevelt Ave
Your Personal Tour Guide
Ask me questions while you tour the home.