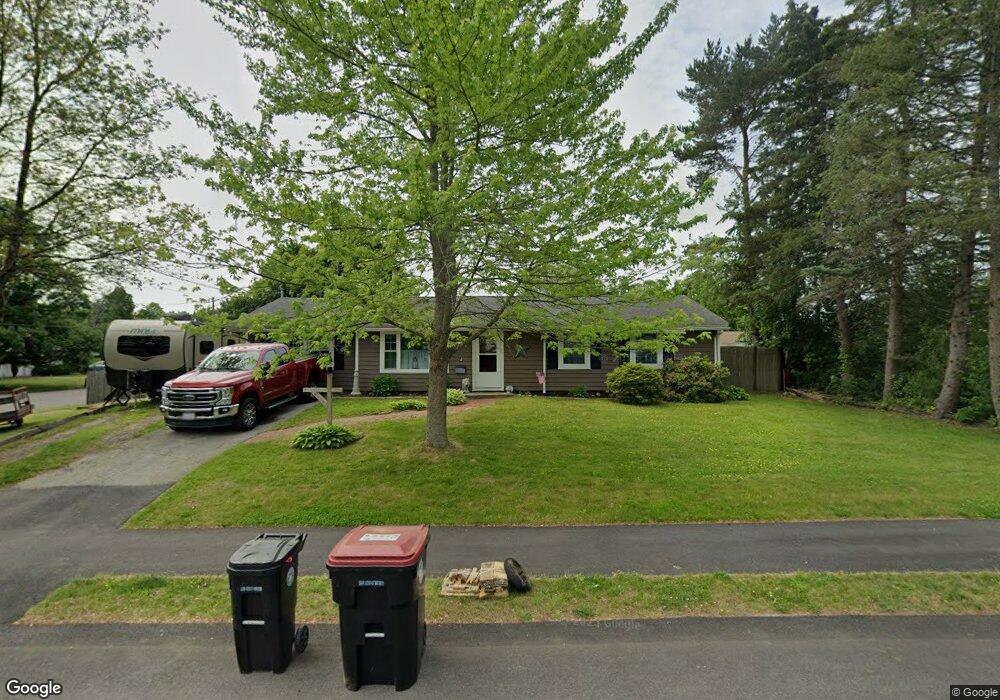
79 Heath St Brockton, MA 02302
Estimated Value: $458,000 - $519,000
3
Beds
1
Bath
1,316
Sq Ft
$373/Sq Ft
Est. Value
About This Home
This home is located at 79 Heath St, Brockton, MA 02302 and is currently estimated at $490,538, approximately $372 per square foot. 79 Heath St is a home located in Plymouth County with nearby schools including Davis K-8 School, John F. Kennedy Elementary School, and South Middle School.
Ownership History
Date
Name
Owned For
Owner Type
Purchase Details
Closed on
Nov 1, 1989
Sold by
Merlino Anthony J
Bought by
Rondeau Leonard J
Current Estimated Value
Home Financials for this Owner
Home Financials are based on the most recent Mortgage that was taken out on this home.
Original Mortgage
$103,200
Interest Rate
9.9%
Mortgage Type
Purchase Money Mortgage
Create a Home Valuation Report for This Property
The Home Valuation Report is an in-depth analysis detailing your home's value as well as a comparison with similar homes in the area
Home Values in the Area
Average Home Value in this Area
Purchase History
| Date | Buyer | Sale Price | Title Company |
|---|---|---|---|
| Rondeau Leonard J | $129,000 | -- |
Source: Public Records
Mortgage History
| Date | Status | Borrower | Loan Amount |
|---|---|---|---|
| Closed | Rondeau Leonard J | $103,200 | |
| Previous Owner | Rondeau Leonard J | $20,000 |
Source: Public Records
Tax History Compared to Growth
Tax History
| Year | Tax Paid | Tax Assessment Tax Assessment Total Assessment is a certain percentage of the fair market value that is determined by local assessors to be the total taxable value of land and additions on the property. | Land | Improvement |
|---|---|---|---|---|
| 2025 | $4,605 | $380,300 | $160,700 | $219,600 |
| 2024 | $4,518 | $375,900 | $160,700 | $215,200 |
| 2023 | $4,344 | $334,700 | $111,000 | $223,700 |
| 2022 | $4,008 | $286,900 | $100,900 | $186,000 |
| 2021 | $4,051 | $279,400 | $93,800 | $185,600 |
| 2020 | $3,959 | $261,300 | $82,200 | $179,100 |
| 2019 | $3,708 | $238,600 | $78,600 | $160,000 |
| 2018 | $3,517 | $219,000 | $78,600 | $140,400 |
| 2017 | $2,914 | $181,000 | $78,600 | $102,400 |
| 2016 | $3,142 | $181,000 | $74,900 | $106,100 |
| 2015 | $2,697 | $148,600 | $74,900 | $73,700 |
| 2014 | $2,928 | $161,500 | $74,900 | $86,600 |
Source: Public Records
Map
Nearby Homes