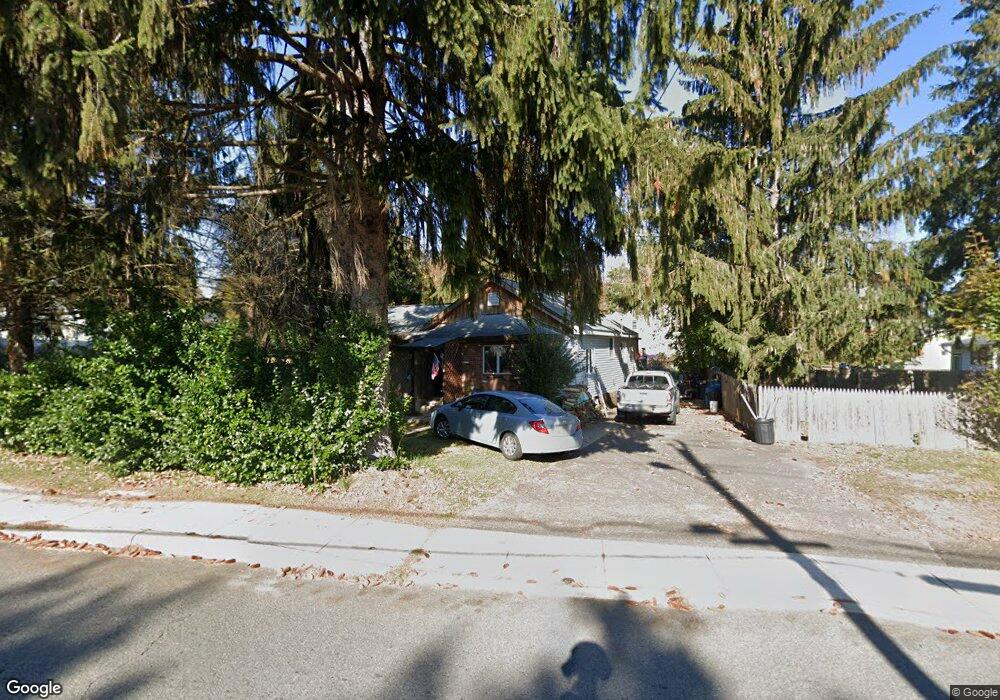
79 High St Franklin, NJ 07416
Estimated Value: $306,185 - $354,000
Studio
--
Bath
1,170
Sq Ft
$286/Sq Ft
Est. Value
About This Home
This home is located at 79 High St, Franklin, NJ 07416 and is currently estimated at $334,546, approximately $285 per square foot. 79 High St is a home located in Sussex County with nearby schools including Franklin Elementary School, Wallkill Valley Regional High School, and Immaculate Conception Regional School.
Ownership History
Date
Name
Owned For
Owner Type
Purchase Details
Closed on
Dec 15, 2011
Sold by
Brown Arthur J and Brown Judith A
Bought by
Brown Arthur J and Brown Judith A
Current Estimated Value
Purchase Details
Closed on
Aug 13, 2008
Sold by
Brown Victor A and Brown Cosma D
Bought by
Brown Arthur J and Brown Judith A
Purchase Details
Closed on
Jun 24, 1996
Sold by
Brown Judith A
Bought by
Brown Victor A and Brown Cosma D
Create a Home Valuation Report for This Property
The Home Valuation Report is an in-depth analysis detailing your home's value as well as a comparison with similar homes in the area
Home Values in the Area
Average Home Value in this Area
Purchase History
| Date | Buyer | Sale Price | Title Company |
|---|---|---|---|
| Brown Arthur J | -- | None Available | |
| Brown Arthur J | -- | None Available | |
| Brown Victor A | -- | -- |
Source: Public Records
Tax History
| Year | Tax Paid | Tax Assessment Tax Assessment Total Assessment is a certain percentage of the fair market value that is determined by local assessors to be the total taxable value of land and additions on the property. | Land | Improvement |
|---|---|---|---|---|
| 2025 | $5,711 | $241,400 | $102,600 | $138,800 |
| 2024 | $5,657 | $215,200 | $81,700 | $133,500 |
Source: Public Records
Map
Nearby Homes
- 62 High St
- 52 High St
- 66 Nestor St
- 19 John Wilton St Unit 21
- 35 Liberty Ln Unit Y2
- 20 High Point CI
- 26 Wyker Rd Unit A
- 112 Scott Rd
- 63 Liberty Ln Unit 7
- 65 Buckwheat Rd
- 580 State Rt 23
- 140 Wheatsworth Rd
- 6 Mulberry St
- 212 New Jersey 23
- 149 Maple Rd
- 17 Emerald Dr
- 7 Emerald Dr
- 18 Emerald Dr
- 142 Wheatsworth Rd
- 172 Maple Rd
- 311 Rutherford Ave
- 75 High St
- 313 Rutherford Ave
- 307 Rutherford Ave
- 14 Cummins St
- 305 Rutherford Ave
- 10 Cummins St
- 73 High St
- 310 Rutherford Ave
- 310 Rutherford Ave Unit 3100
- 316 Rutherford Ave
- 301 Rutherford Ave
- 3 Cummins St
- 57 Cummins St
- 5-7 Cummins St Unit 2
- 1 Cummins St
- 318 Rutherford Ave
- 140 Buckwheat Rd
- 20 Cummins St
- 5 Cummins St Unit 2
Your Personal Tour Guide
Ask me questions while you tour the home.