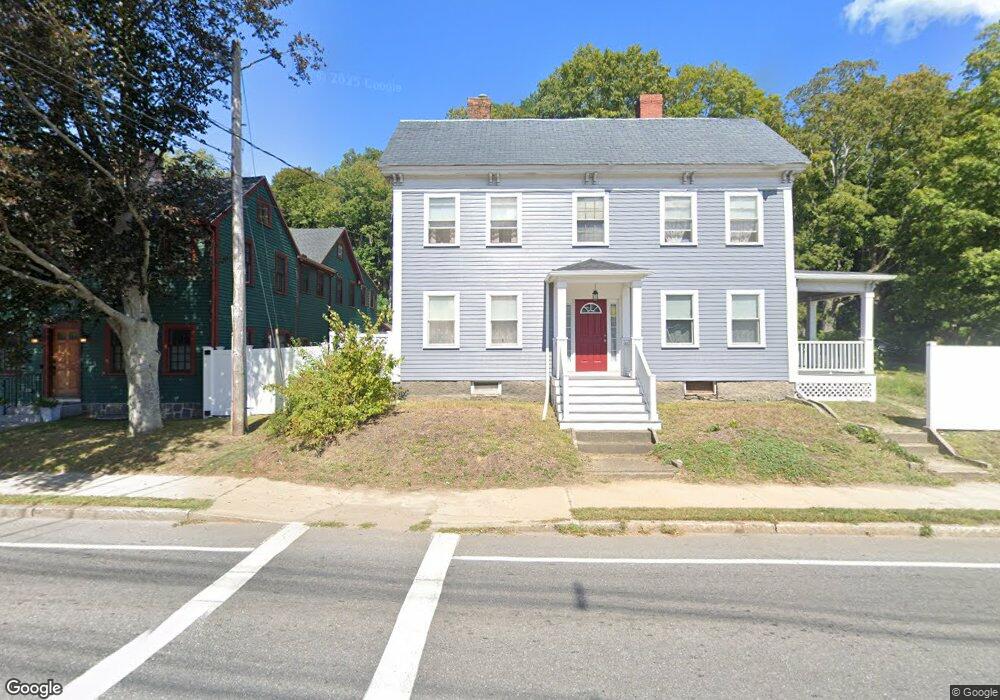
79 High St Ipswich, MA 01938
Estimated Value: $816,000 - $993,000
6
Beds
2
Baths
2,962
Sq Ft
$302/Sq Ft
Est. Value
About This Home
This home is located at 79 High St, Ipswich, MA 01938 and is currently estimated at $894,527, approximately $302 per square foot. 79 High St is a home located in Essex County with nearby schools including Ipswich High School, North Shore Montessori School, and Clark School.
Ownership History
Date
Name
Owned For
Owner Type
Purchase Details
Closed on
Apr 16, 1992
Sold by
Est Blodgett Helen J
Bought by
Cullen Daniel R and Cullen Sarah J
Current Estimated Value
Home Financials for this Owner
Home Financials are based on the most recent Mortgage that was taken out on this home.
Original Mortgage
$120,000
Interest Rate
8.75%
Mortgage Type
Purchase Money Mortgage
Create a Home Valuation Report for This Property
The Home Valuation Report is an in-depth analysis detailing your home's value as well as a comparison with similar homes in the area
Home Values in the Area
Average Home Value in this Area
Purchase History
| Date | Buyer | Sale Price | Title Company |
|---|---|---|---|
| Cullen Daniel R | $150,000 | -- |
Source: Public Records
Mortgage History
| Date | Status | Borrower | Loan Amount |
|---|---|---|---|
| Closed | Cullen Daniel R | $119,000 | |
| Closed | Cullen Daniel R | $119,000 | |
| Closed | Cullen Daniel R | $120,000 |
Source: Public Records
Tax History
| Year | Tax Paid | Tax Assessment Tax Assessment Total Assessment is a certain percentage of the fair market value that is determined by local assessors to be the total taxable value of land and additions on the property. | Land | Improvement |
|---|---|---|---|---|
| 2025 | $9,728 | $872,500 | $368,800 | $503,700 |
| 2024 | $8,081 | $710,100 | $370,600 | $339,500 |
| 2023 | $7,885 | $644,700 | $305,200 | $339,500 |
| 2022 | $8,067 | $627,300 | $287,800 | $339,500 |
| 2021 | $8,073 | $610,700 | $283,400 | $327,300 |
| 2020 | $8,032 | $572,900 | $263,800 | $309,100 |
| 2019 | $7,919 | $562,000 | $252,900 | $309,100 |
| 2018 | $7,660 | $537,900 | $239,900 | $298,000 |
| 2017 | $7,558 | $532,600 | $229,000 | $303,600 |
| 2016 | $6,344 | $427,200 | $198,500 | $228,700 |
| 2015 | $5,859 | $433,700 | $205,000 | $228,700 |
Source: Public Records
Map
Nearby Homes
- 8 Cleveland Ave
- 11 Washington St Unit 11
- 11 Washington St Unit 7
- 11 Washington St Unit 5
- 11 Washington St Unit 4
- 11 Washington St Unit 12
- 20 Caroline Ave
- 9 Ryan Ave
- 50 Market St Unit 2
- 21 Brownville Ave
- 29 Summer St Unit 15
- 59 S Main St Unit 1
- 16 Elm St
- 45 County St Unit 4
- 64 County Rd Unit 1
- 57 East St
- 70 East St
- 7 Woods Ln
- 500 Colonial Dr Unit 5
- 500 Colonial Dr Unit 310
Your Personal Tour Guide
Ask me questions while you tour the home.