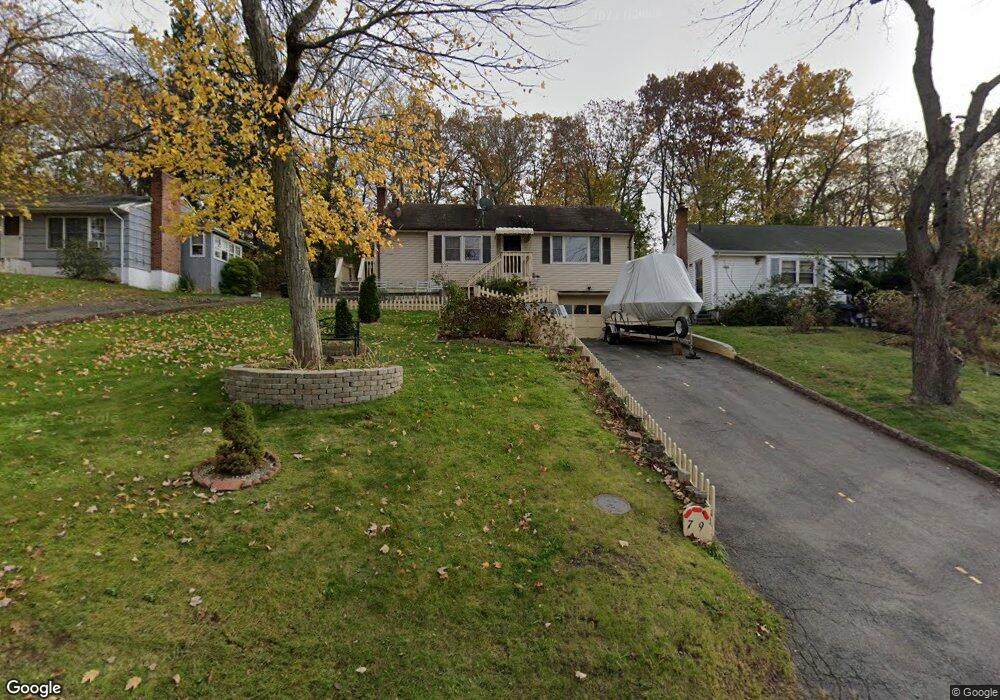
79 Highview St East Hartford, CT 06108
Estimated Value: $223,000 - $288,000
3
Beds
1
Bath
960
Sq Ft
$268/Sq Ft
Est. Value
About This Home
This home is located at 79 Highview St, East Hartford, CT 06108 and is currently estimated at $257,254, approximately $267 per square foot. 79 Highview St is a home located in Hartford County with nearby schools including Dr. Franklin H. Mayberry School, East Hartford Middle School, and East Hartford High School.
Ownership History
Date
Name
Owned For
Owner Type
Purchase Details
Closed on
Aug 31, 1999
Sold by
Potter Halina
Bought by
Thompson Lillieth M
Current Estimated Value
Home Financials for this Owner
Home Financials are based on the most recent Mortgage that was taken out on this home.
Original Mortgage
$76,329
Interest Rate
7.53%
Purchase Details
Closed on
Jun 8, 1987
Sold by
Rodrigue Michael E
Bought by
Potter Steven
Home Financials for this Owner
Home Financials are based on the most recent Mortgage that was taken out on this home.
Original Mortgage
$112,000
Interest Rate
10.38%
Create a Home Valuation Report for This Property
The Home Valuation Report is an in-depth analysis detailing your home's value as well as a comparison with similar homes in the area
Home Values in the Area
Average Home Value in this Area
Purchase History
| Date | Buyer | Sale Price | Title Company |
|---|---|---|---|
| Thompson Lillieth M | $77,000 | -- | |
| Potter Steven | $124,500 | -- |
Source: Public Records
Mortgage History
| Date | Status | Borrower | Loan Amount |
|---|---|---|---|
| Open | Potter Steven | $111,660 | |
| Closed | Potter Steven | $76,329 | |
| Previous Owner | Potter Steven | $112,000 |
Source: Public Records
Tax History Compared to Growth
Tax History
| Year | Tax Paid | Tax Assessment Tax Assessment Total Assessment is a certain percentage of the fair market value that is determined by local assessors to be the total taxable value of land and additions on the property. | Land | Improvement |
|---|---|---|---|---|
| 2025 | $5,603 | $122,060 | $37,070 | $84,990 |
| 2024 | $5,371 | $122,060 | $37,070 | $84,990 |
| 2023 | $5,192 | $122,060 | $37,070 | $84,990 |
| 2022 | $5,004 | $122,060 | $37,070 | $84,990 |
| 2021 | $4,499 | $91,170 | $28,080 | $63,090 |
| 2020 | $4,551 | $91,170 | $28,080 | $63,090 |
| 2019 | $4,477 | $91,170 | $28,080 | $63,090 |
| 2018 | $4,345 | $91,170 | $28,080 | $63,090 |
| 2017 | $4,290 | $91,170 | $28,080 | $63,090 |
| 2016 | $4,009 | $87,410 | $28,080 | $59,330 |
| 2015 | $4,009 | $87,410 | $28,080 | $59,330 |
| 2014 | $3,968 | $87,410 | $28,080 | $59,330 |
Source: Public Records
Map
Nearby Homes
- 15 Christine Dr
- 95 Arnold Dr
- 73 Walnut St
- 207 Arnold Dr
- 90 Christine Dr
- 13-15 Burnside Ave
- 1220 Burnside Ave Unit A
- 47 Bodwell Rd
- 1166 Middle Turnpike W Unit B1
- 0 Hillside Ave
- 952 Tolland St
- 127 Ridgewood Rd
- 26 Casabella Cir Unit 28
- 8 Howard Ct Unit 10
- 73 Bliss St
- 40 Larrabee St
- 61 Leverich Dr
- 334 Forbes St
- 59 Laraia Ave
- 4 Gladys Rd