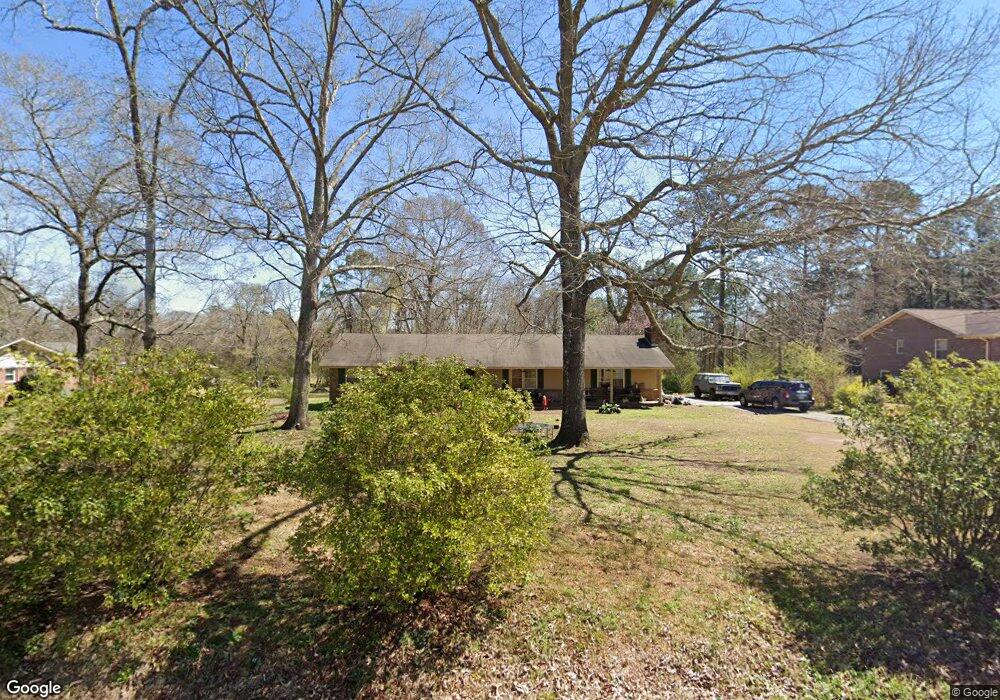
79 Iris Dr Lagrange, GA 30241
Estimated Value: $247,274 - $278,000
3
Beds
2
Baths
2,312
Sq Ft
$112/Sq Ft
Est. Value
About This Home
This home is located at 79 Iris Dr, Lagrange, GA 30241 and is currently estimated at $259,319, approximately $112 per square foot. 79 Iris Dr is a home located in Troup County with nearby schools including Callaway Elementary School, Hogansville Elementary School, and Callaway Middle School.
Ownership History
Date
Name
Owned For
Owner Type
Purchase Details
Closed on
Mar 18, 2011
Sold by
Branch Banking
Bought by
Sheppard Stuart W
Current Estimated Value
Home Financials for this Owner
Home Financials are based on the most recent Mortgage that was taken out on this home.
Original Mortgage
$65,301
Outstanding Balance
$44,717
Interest Rate
4.95%
Mortgage Type
FHA
Estimated Equity
$214,602
Purchase Details
Closed on
Jun 14, 2010
Sold by
Leveritt Judith A
Bought by
Branch Banking
Purchase Details
Closed on
Mar 20, 2002
Sold by
Judie Leverett
Bought by
Leveritt Judith A
Purchase Details
Closed on
Dec 1, 1988
Sold by
Ray W Adams
Bought by
Judie Leverett
Purchase Details
Closed on
Feb 1, 1988
Sold by
Gorman Thomas and Gorman Ruby J
Bought by
Ray W Adams
Purchase Details
Closed on
Jan 29, 1974
Sold by
Joe Birdwell
Bought by
Gorman Thomas and Gorman Ruby J
Purchase Details
Closed on
Nov 1, 1966
Sold by
Robinson G E
Bought by
Joe Birdwell
Create a Home Valuation Report for This Property
The Home Valuation Report is an in-depth analysis detailing your home's value as well as a comparison with similar homes in the area
Purchase History
| Date | Buyer | Sale Price | Title Company |
|---|---|---|---|
| Sheppard Stuart W | $67,000 | -- | |
| Branch Banking | $120,000 | -- | |
| Leveritt Judith A | -- | -- | |
| Judie Leverett | $69,000 | -- | |
| Ray W Adams | -- | -- | |
| Gorman Thomas | -- | -- | |
| Joe Birdwell | -- | -- |
Source: Public Records
Mortgage History
| Date | Status | Borrower | Loan Amount |
|---|---|---|---|
| Open | Branch Banking | $65,301 |
Source: Public Records
Tax History
| Year | Tax Paid | Tax Assessment Tax Assessment Total Assessment is a certain percentage of the fair market value that is determined by local assessors to be the total taxable value of land and additions on the property. | Land | Improvement |
|---|---|---|---|---|
| 2025 | $2,141 | $78,520 | $10,000 | $68,520 |
| 2024 | $1,657 | $60,760 | $10,000 | $50,760 |
| 2023 | $1,646 | $60,360 | $10,000 | $50,360 |
| 2022 | $1,581 | $56,640 | $10,000 | $46,640 |
| 2021 | $1,418 | $47,000 | $6,000 | $41,000 |
| 2020 | $1,418 | $47,000 | $6,000 | $41,000 |
| 2019 | $1,380 | $45,760 | $4,800 | $40,960 |
| 2018 | $1,237 | $41,000 | $4,800 | $36,200 |
| 2017 | $1,237 | $41,000 | $4,800 | $36,200 |
| 2016 | $1,253 | $41,536 | $4,800 | $36,736 |
| 2015 | $1,255 | $41,536 | $4,800 | $36,736 |
| 2014 | $1,257 | $41,536 | $4,800 | $36,736 |
| 2013 | -- | $46,228 | $4,800 | $41,428 |
Source: Public Records
Map
Nearby Homes
- 200 River Meadow Dr
- 234 River Meadow Dr
- 200 Freshwater Ct Unit 37
- 302 Glenhaven Dr Unit 2D
- 300 Glenhaven Dr Unit 1D
- 202 Freshwater Ct Unit E36
- 202 Freshwater Ct
- 204 Freshwater Ct
- 503 Headwater Ct Unit 4D
- 119 Sir Lancelot St
- 106 Shenandoah Ln Unit 26E
- 106 Shenandoah Ln
- 206 Freshwater Ct Unit 34E
- 206 Freshwater Ct
- 502 Headwater Ct Unit 8D
- 402 Sweetwood Ct Unit LOT 2
- 108 Shenandoah Ln
- 108 Shenandoah Ln Unit 27E
- 114 Shenandoah Ln
- 117 Shenandoah Ln Unit 22D
Your Personal Tour Guide
Ask me questions while you tour the home.