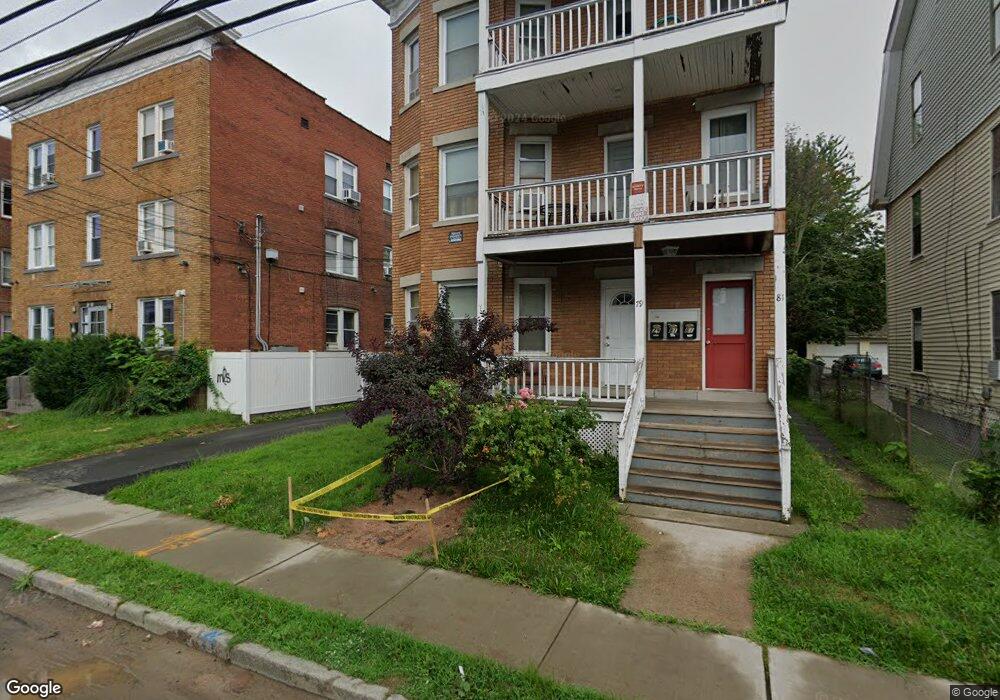
79 James St Unit 81 Hartford, CT 06106
Parkville NeighborhoodEstimated Value: $443,013 - $531,000
6
Beds
3
Baths
4,412
Sq Ft
$111/Sq Ft
Est. Value
About This Home
This home is located at 79 James St Unit 81, Hartford, CT 06106 and is currently estimated at $490,003, approximately $111 per square foot. 79 James St Unit 81 is a home located in Hartford County with nearby schools including Burns Latino Studies Academy, Sanchez School, and Environmental Sciences Magnet School at Mary Hooker.
Ownership History
Date
Name
Owned For
Owner Type
Purchase Details
Closed on
Apr 1, 2014
Sold by
Letson Barbara C Est
Bought by
Dehaney Opal
Current Estimated Value
Home Financials for this Owner
Home Financials are based on the most recent Mortgage that was taken out on this home.
Original Mortgage
$227,401
Outstanding Balance
$171,902
Interest Rate
4.27%
Mortgage Type
New Conventional
Estimated Equity
$318,101
Purchase Details
Closed on
Feb 14, 2005
Sold by
Lyra Madeline
Bought by
Leston John and Leston Barbara
Home Financials for this Owner
Home Financials are based on the most recent Mortgage that was taken out on this home.
Original Mortgage
$179,500
Interest Rate
5.83%
Purchase Details
Closed on
Nov 29, 2000
Sold by
Ramos Faustino and Ramos Guilhermia
Bought by
Lyra Madeline
Create a Home Valuation Report for This Property
The Home Valuation Report is an in-depth analysis detailing your home's value as well as a comparison with similar homes in the area
Home Values in the Area
Average Home Value in this Area
Purchase History
| Date | Buyer | Sale Price | Title Company |
|---|---|---|---|
| Dehaney Opal | $231,600 | -- | |
| Leston John | $224,400 | -- | |
| Lyra Madeline | $125,000 | -- |
Source: Public Records
Mortgage History
| Date | Status | Borrower | Loan Amount |
|---|---|---|---|
| Open | Lyra Madeline | $227,401 | |
| Closed | Lyra Madeline | $5,600 | |
| Previous Owner | Lyra Madeline | $179,500 | |
| Previous Owner | Lyra Madeline | $44,900 |
Source: Public Records
Tax History Compared to Growth
Tax History
| Year | Tax Paid | Tax Assessment Tax Assessment Total Assessment is a certain percentage of the fair market value that is determined by local assessors to be the total taxable value of land and additions on the property. | Land | Improvement |
|---|---|---|---|---|
| 2025 | $8,111 | $117,637 | $7,019 | $110,618 |
| 2024 | $8,111 | $117,637 | $7,019 | $110,618 |
| 2023 | $8,111 | $117,637 | $7,019 | $110,618 |
| 2022 | $4,275 | $117,637 | $7,019 | $110,618 |
| 2021 | $4,275 | $57,540 | $8,365 | $49,175 |
| 2020 | $4,275 | $57,540 | $8,365 | $49,175 |
| 2019 | $4,275 | $57,540 | $8,365 | $49,175 |
| 2018 | $4,131 | $55,600 | $8,083 | $47,517 |
| 2016 | $3,022 | $40,681 | $7,698 | $32,983 |
| 2015 | $2,879 | $38,749 | $7,333 | $31,416 |
| 2014 | $2,808 | $37,802 | $7,154 | $30,648 |
Source: Public Records
Map
Nearby Homes
- 54 James St Unit 56
- 126 Heath St
- 90-92 Rowe Ave
- 82 S Whitney St
- 39 S Whitney St
- 18 S Whitney St
- 478 Prospect Ave
- 2 Rodney St
- 16 Lockwood Terrace
- 45 Warrenton Ave Unit 47
- 21 Warren Terrace
- 27 Sisson Ave Unit 29
- 518 Prospect Ave
- 34 Sisson Ave
- 101 Madison Ave
- 89 Madison Ave Unit 91
- 46 New Park Ave
- 14 Gray St Unit 16
- 838 Capitol Ave Unit 840
- 39 Fairlawn St
- 79 James St Unit 1
- 79 James St Unit 2
- 83 James St
- 82 James St
- 82 James St
- 69 James St Unit 105
- 69 James St
- 69-71 James St
- 76 James St Unit 78
- 88 James St Unit 90
- 82 James St
- 82 James St Unit 3-R
- 82 James St Unit 2-S
- 82 James St Unit 3N
- 72 James St Unit 74
- 66 James St Unit 68
- 95 James St Unit 2
- 95 James St Unit 3
- 89 James St
- 89 James St Unit 1S