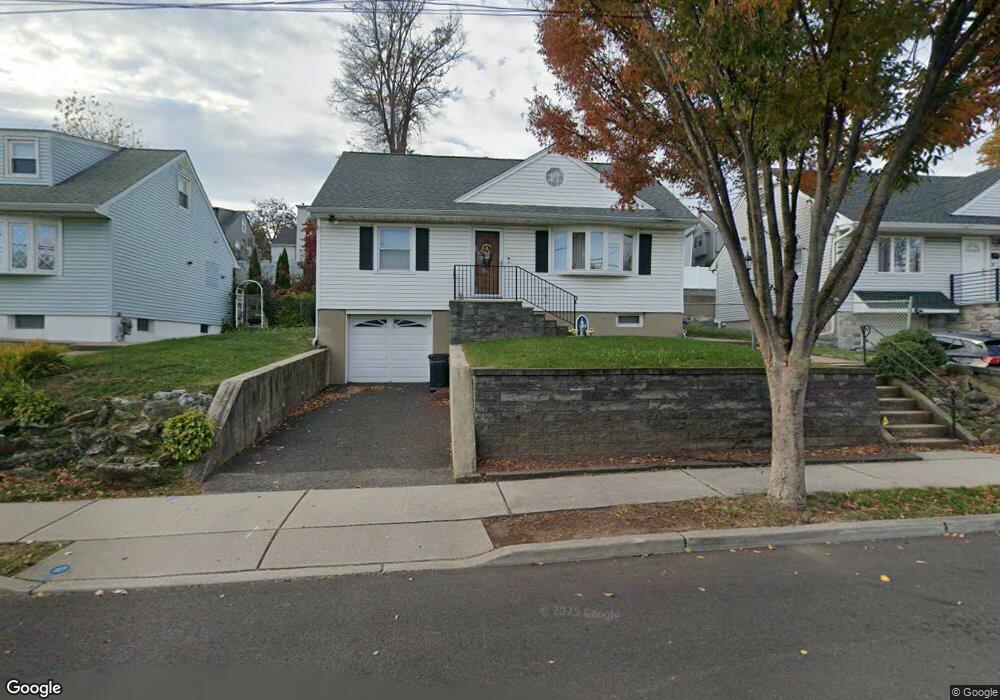
79 Jefferson St Wood Ridge, NJ 07075
Estimated Value: $571,406 - $711,000
--
Bed
--
Bath
1,400
Sq Ft
$468/Sq Ft
Est. Value
About This Home
This home is located at 79 Jefferson St, Wood Ridge, NJ 07075 and is currently estimated at $655,852, approximately $468 per square foot. 79 Jefferson St is a home located in Bergen County with nearby schools including Catherine E. Doyle Elementary School, Wood Ridge Intermediate School, and Wood Ridge High School.
Ownership History
Date
Name
Owned For
Owner Type
Purchase Details
Closed on
Aug 29, 2001
Sold by
Foxall George
Bought by
Rizzo Maria
Current Estimated Value
Home Financials for this Owner
Home Financials are based on the most recent Mortgage that was taken out on this home.
Original Mortgage
$183,200
Outstanding Balance
$71,386
Interest Rate
6.98%
Estimated Equity
$584,466
Purchase Details
Closed on
Sep 21, 1995
Sold by
Mauro Frank
Bought by
Foxall George
Home Financials for this Owner
Home Financials are based on the most recent Mortgage that was taken out on this home.
Original Mortgage
$144,000
Interest Rate
7.89%
Create a Home Valuation Report for This Property
The Home Valuation Report is an in-depth analysis detailing your home's value as well as a comparison with similar homes in the area
Home Values in the Area
Average Home Value in this Area
Purchase History
| Date | Buyer | Sale Price | Title Company |
|---|---|---|---|
| Rizzo Maria | $229,000 | -- | |
| Foxall George | $180,000 | -- |
Source: Public Records
Mortgage History
| Date | Status | Borrower | Loan Amount |
|---|---|---|---|
| Open | Rizzo Maria | $183,200 | |
| Previous Owner | Foxall George | $144,000 |
Source: Public Records
Tax History Compared to Growth
Tax History
| Year | Tax Paid | Tax Assessment Tax Assessment Total Assessment is a certain percentage of the fair market value that is determined by local assessors to be the total taxable value of land and additions on the property. | Land | Improvement |
|---|---|---|---|---|
| 2025 | $10,067 | $351,000 | $201,500 | $149,500 |
| 2024 | $9,916 | $351,000 | $201,500 | $149,500 |
| 2023 | $9,810 | $351,000 | $201,500 | $149,500 |
| 2022 | $9,810 | $351,000 | $201,500 | $149,500 |
| 2021 | $9,909 | $351,000 | $201,500 | $149,500 |
| 2020 | $9,884 | $351,000 | $201,500 | $149,500 |
| 2019 | $9,737 | $351,000 | $201,500 | $149,500 |
| 2018 | $9,417 | $351,000 | $201,500 | $149,500 |
| 2017 | $9,196 | $351,000 | $201,500 | $149,500 |
| 2016 | $8,567 | $223,500 | $126,500 | $97,000 |
| 2015 | $8,421 | $223,500 | $126,500 | $97,000 |
| 2014 | $8,249 | $223,500 | $126,500 | $97,000 |
Source: Public Records
Map
Nearby Homes
- 88 Columbia St
- 340 Marsan Dr
- 573 Anderson Ave
- 38 Hackensack St
- 53 Hackensack St
- 167 Columbia St
- 30 Humboldt St
- 165 Madison St
- 148 Hackensack St
- 176 Hackensack St Unit 6
- 206 Columbia St
- 522 9th St
- 560 Ryerson Ave
- 89 Rose St
- 245 Cliff St
- 344 10th St
- 426 Broad St
- 476 Innes Rd
- 364 Wood Ridge Ave
- 507 Washington St