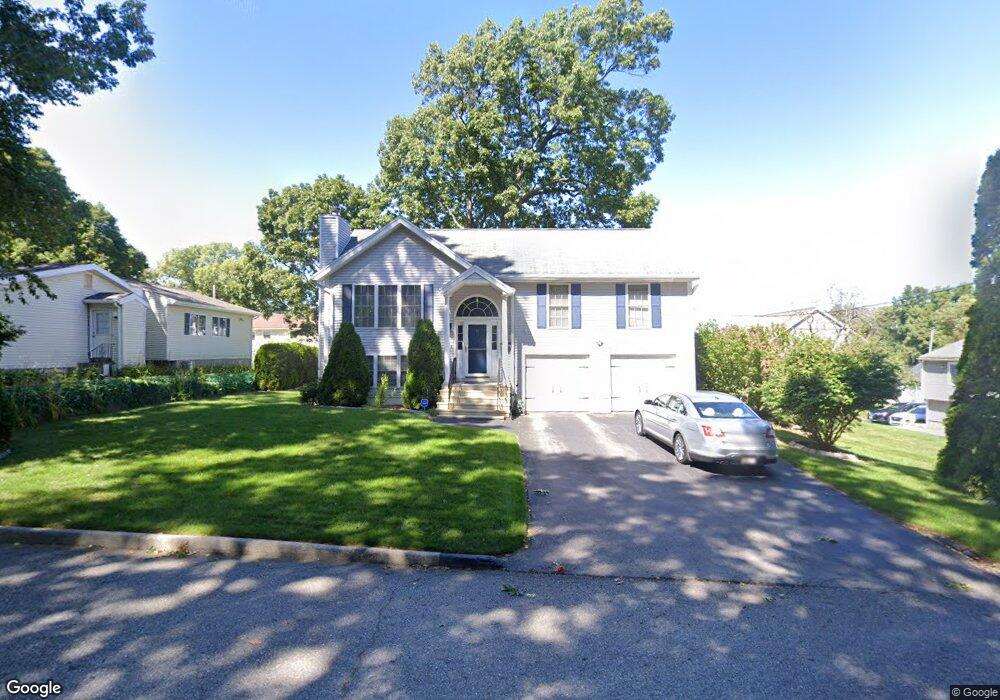
79 Jennings St Worcester, MA 01604
Grafton Hill NeighborhoodEstimated Value: $445,000 - $519,000
4
Beds
2
Baths
1,056
Sq Ft
$453/Sq Ft
Est. Value
About This Home
This home is located at 79 Jennings St, Worcester, MA 01604 and is currently estimated at $478,277, approximately $452 per square foot. 79 Jennings St is a home located in Worcester County with nearby schools including Roosevelt Elementary School, Jacob Hiatt Magnet School, and Chandler Magnet.
Ownership History
Date
Name
Owned For
Owner Type
Purchase Details
Closed on
Jul 11, 1997
Sold by
Highland North Corp
Bought by
Leblanc Charles L and Leblanc Annalisam
Current Estimated Value
Home Financials for this Owner
Home Financials are based on the most recent Mortgage that was taken out on this home.
Original Mortgage
$123,400
Interest Rate
7.86%
Mortgage Type
Purchase Money Mortgage
Create a Home Valuation Report for This Property
The Home Valuation Report is an in-depth analysis detailing your home's value as well as a comparison with similar homes in the area
Home Values in the Area
Average Home Value in this Area
Purchase History
| Date | Buyer | Sale Price | Title Company |
|---|---|---|---|
| Leblanc Charles L | $129,900 | -- |
Source: Public Records
Mortgage History
| Date | Status | Borrower | Loan Amount |
|---|---|---|---|
| Open | Leblanc Charles L | $182,700 | |
| Closed | Leblanc Charles L | $42,500 | |
| Closed | Leblanc Charles L | $123,400 | |
| Previous Owner | Leblanc Charles L | $80,000 |
Source: Public Records
Tax History
| Year | Tax Paid | Tax Assessment Tax Assessment Total Assessment is a certain percentage of the fair market value that is determined by local assessors to be the total taxable value of land and additions on the property. | Land | Improvement |
|---|---|---|---|---|
| 2025 | $5,473 | $414,900 | $117,600 | $297,300 |
| 2024 | $5,334 | $387,900 | $117,600 | $270,300 |
| 2023 | $5,198 | $362,500 | $102,200 | $260,300 |
| 2022 | $4,592 | $301,900 | $81,800 | $220,100 |
| 2021 | $4,459 | $273,900 | $65,400 | $208,500 |
| 2020 | $4,267 | $251,000 | $65,400 | $185,600 |
| 2019 | $4,163 | $231,300 | $58,800 | $172,500 |
| 2018 | $4,190 | $221,600 | $58,800 | $162,800 |
| 2017 | $4,021 | $209,200 | $58,800 | $150,400 |
| 2016 | $3,957 | $192,000 | $42,800 | $149,200 |
| 2015 | $3,853 | $192,000 | $42,800 | $149,200 |
| 2014 | $3,752 | $192,000 | $42,800 | $149,200 |
Source: Public Records
Map
Nearby Homes
- 41 Modoc St
- 143 Commonwealth Ave
- 12 Benham St
- 21 Middlesex Ave Unit 102
- Lot B Crawford St
- 19 Middlesex Ave
- 496 Hamilton St
- 360 Hamilton St
- 28 Nonquit St
- 16 Arborwood Dr
- 340 Sunderland Rd Unit 28
- 81 Bay View Dr
- 190 S Quinsigamond Ave Unit 102
- 241 Lake Ave
- 16-18 Fairfax St
- 330 Sunderland Rd Unit 80
- 143 Dorcester
- 62 Edgemere Blvd
- 53 Denver Terrace
- 23 Bay View Dr
Your Personal Tour Guide
Ask me questions while you tour the home.