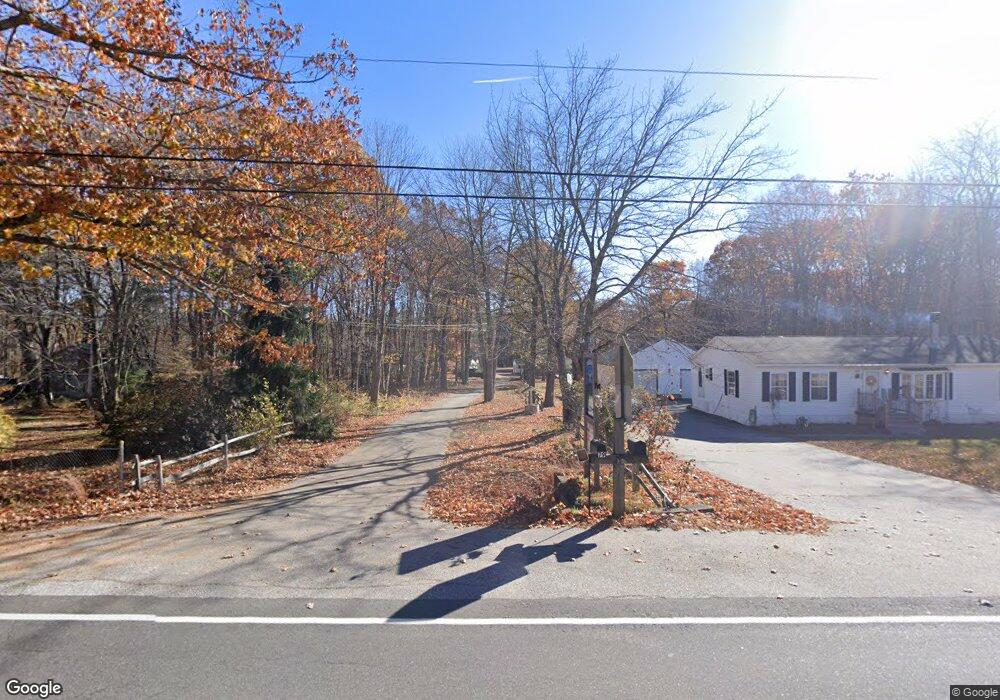
79 Kennebunk Pond Rd Lyman, ME 04002
Lyman Neighborhood
--
Bed
--
Bath
--
Sq Ft
--
Built
About This Home
This home is located at 79 Kennebunk Pond Rd, Lyman, ME 04002. 79 Kennebunk Pond Rd is a home with nearby schools including Massabesic High School.
Create a Home Valuation Report for This Property
The Home Valuation Report is an in-depth analysis detailing your home's value as well as a comparison with similar homes in the area
Home Values in the Area
Average Home Value in this Area
Tax History
| Year | Tax Paid | Tax Assessment Tax Assessment Total Assessment is a certain percentage of the fair market value that is determined by local assessors to be the total taxable value of land and additions on the property. | Land | Improvement |
|---|---|---|---|---|
| 2024 | $4,540 | $360,000 | $80,000 | $280,000 |
| 2023 | $4,388 | $360,000 | $80,000 | $280,000 |
| 2022 | $4,212 | $360,000 | $80,000 | $280,000 |
| 2021 | $4,133 | $360,000 | $80,000 | $280,000 |
| 2020 | $3,988 | $371,000 | $81,000 | $290,000 |
| 2019 | $3,884 | $371,000 | $81,000 | $290,000 |
| 2018 | $3,896 | $322,000 | $68,000 | $254,000 |
| 2017 | $3,635 | $291,000 | $62,500 | $228,500 |
| 2015 | $3,440 | $277,400 | $62,500 | $214,900 |
| 2014 | $3,413 | $280,900 | $66,000 | $214,900 |
Source: Public Records
Map
Nearby Homes
- 19 Day Rd
- 2 New Rd
- 149 Duke Ln
- 66 Shore Rd
- 248 Huff Rd
- 23 Old Post Rd
- Lot# 0 Alewive Rd
- 682 S Waterboro Rd
- 062-2 S Waterboro Rd
- 79 Country Way
- Lot 3 Kennebunk Rd
- 65 Old County Rd
- Lot 00B Knight Farm Rd
- Lot 00E Knight Farm Rd
- Lot 00A Knight Farm Rd
- 87 Drown Rd
- Lot 022 Chappell Shores Dr
- 3 Gerald Ln
- TBD Kennebunk Rd
- 80 Raegan Lynn Rd
- 69 Kennebunk Pond Rd
- 73 Kennebunk Pond Rd
- 77 Kennebunk Pond Rd
- 85 Kennebunk Pond Rd
- Lot # Wyman St
- 65 Kennebunk Pond Rd
- 61 Kennebunk Pond Rd
- 93 Kennebunk Pond Rd
- 19 Kennebunk Pond Rd
- 99 Kennebunk Pond Rd
- 41 Kennebunk Pond Rd
- 103 Kennebunk Pond Rd
- 90 Kennebunk Pond Rd
- 37 Kennebunk Pond Rd
- 109 Kennebunk Pond Rd
- 31 Kennebunk Pond Rd
- 113 Kennebunk Pond Rd
- 25 Kennebunk Pond Rd
- 110 Kennebunk Pond Rd
- TBD Alfred Rd
Your Personal Tour Guide
Ask me questions while you tour the home.