79 Lee St Stoneham, MA 02180
Lindenwood NeighborhoodEstimated Value: $933,223 - $1,076,000
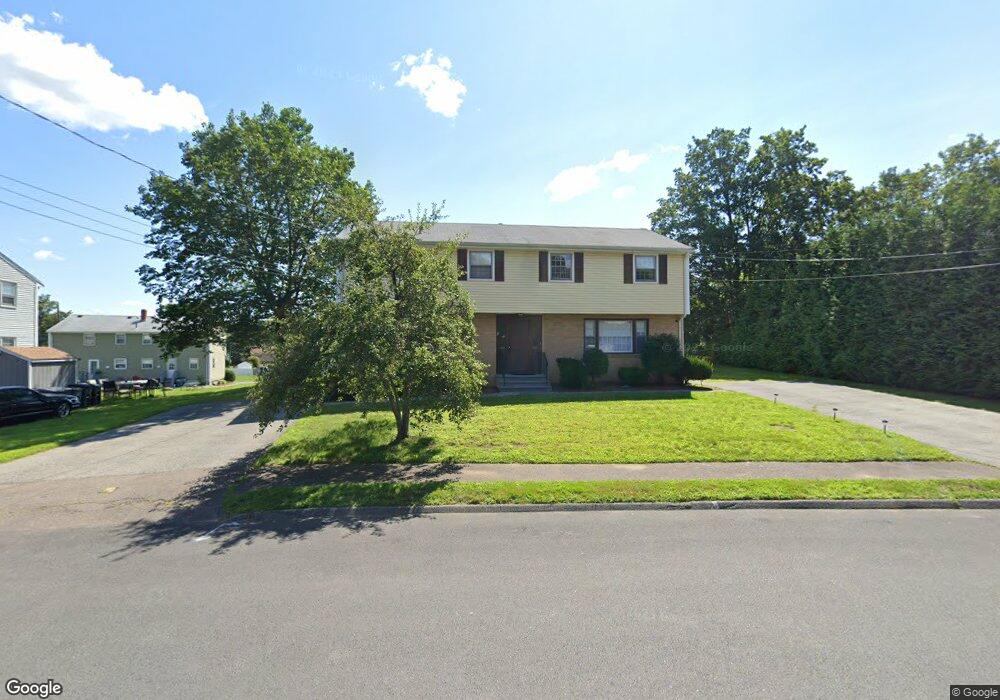
About This Home
This home is located at 79 Lee St, Stoneham, MA 02180 and is currently estimated at $1,012,806, approximately $391 per square foot. 79 Lee St is a home located in Middlesex County with nearby schools including Stoneham High School, St. Patrick Elementary School, and Greater Boston Academy.
Ownership History
We collect this data history from publicly available records. To have your information removed, we recommend requesting removal directly through your county’s website.
Purchase Details
Home Financials for this Owner
Home Financials are based on the most recent Mortgage that was taken out on this home.Home Values in the Area
Average Home Value in this Area
Purchase History
We collect this data history from publicly available records. To have your information removed, we recommend requesting removal directly through your county’s website.
| Date | Buyer | Sale Price | Title Company |
|---|---|---|---|
| $730,000 | None Available | ||
| $730,000 | None Available |
Mortgage History
We collect this data history from publicly available records. To have your information removed, we recommend requesting removal directly through your county’s website.
| Date | Status | Borrower | Loan Amount |
|---|---|---|---|
| Open | $547,500 | ||
| Closed | $547,500 |
Tax History
We collect this data history from publicly available records. To have your information removed, we recommend requesting removal directly through your county’s website.
| Year | Tax Paid | Tax Assessment Tax Assessment Total Assessment is a certain percentage of the fair market value that is determined by local assessors to be the total taxable value of land and additions on the property. | Land | Improvement |
|---|---|---|---|---|
| 2025 | $8,173 | $798,900 | $400,400 | $398,500 |
| 2024 | $8,216 | $775,800 | $370,400 | $405,400 |
| 2023 | $8,278 | $745,800 | $340,400 | $405,400 |
| 2022 | $7,450 | $715,700 | $320,400 | $395,300 |
| 2021 | $7,307 | $675,300 | $300,400 | $374,900 |
| 2020 | $7,058 | $654,100 | $300,400 | $353,700 |
| 2019 | $6,427 | $572,800 | $270,400 | $302,400 |
| 2018 | $6,344 | $541,800 | $250,400 | $291,400 |
| 2017 | $5,896 | $475,900 | $240,400 | $235,500 |
| 2016 | $5,906 | $465,000 | $240,400 | $224,600 |
| 2015 | $5,953 | $459,300 | $240,400 | $218,900 |
| 2014 | $5,701 | $422,600 | $220,400 | $202,200 |
Map
- 5 Elizabeth Rd
- 10 Magnolia Terrace
- 3 Spruce St
- 32 Oak St
- 63 Oak St
- 1 Albert Dr Unit 8
- 100 Ledgewood Dr Unit 410
- 100 Ledgewood Dr Unit 319
- 159 Main St Unit 47C
- 159 Main St Unit 11C
- 159 Main St Unit 44C
- 159 Main St Unit 54A
- 2 O'Connor Ln
- 122 Main St Unit 100
- 122 Main St Unit 402
- 54 Endicott Rd
- 24 Montvale Ave
- 94 William St
- 115 Collincote St
- 68 Main St Unit 44C
- 408 William St
- 5 Lee St
- 407 William St
- 398 William St
- 391 William St
- 418 William St
- 427 William St
- 46 Lee St
- 390 William St
- 387 William St
- 7 Lee St
- 8 Lee St Unit 10
- 8 Lee St
- 50 Country Club Rd
- 12-14 San Jose Terrace Unit 12
- 3 Arnold Rd
- 45 Country Club Rd
- 422 William St
- 12 San Jose Terrace Unit 14
- 8 San Jose Terrace
Ask me questions while you tour the home.