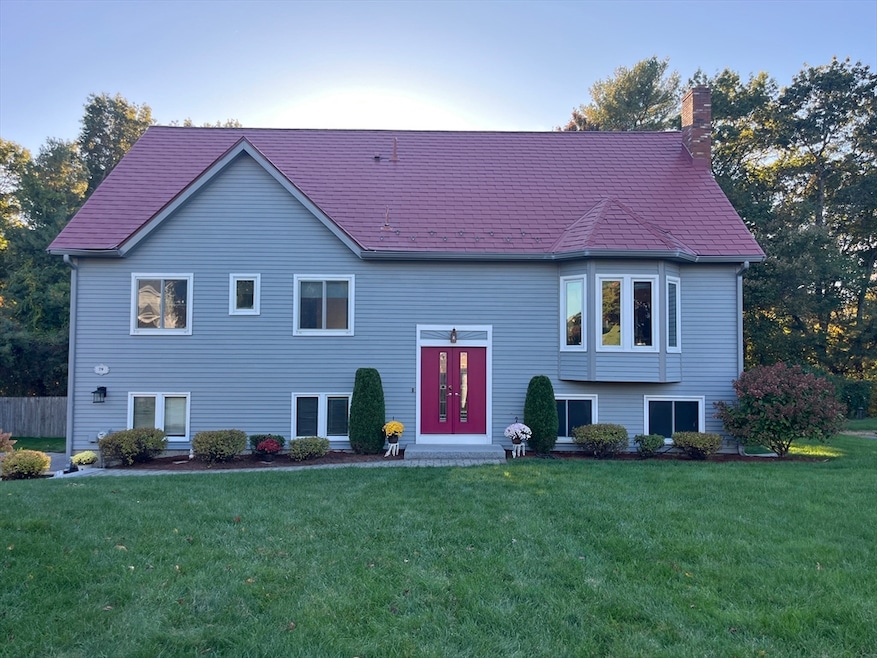
79 Lucas Dr Stoughton, MA 02072
Estimated payment $5,475/month
Highlights
- Golf Course Community
- Above Ground Pool
- 0.73 Acre Lot
- Medical Services
- Solar Power System
- Open Floorplan
About This Home
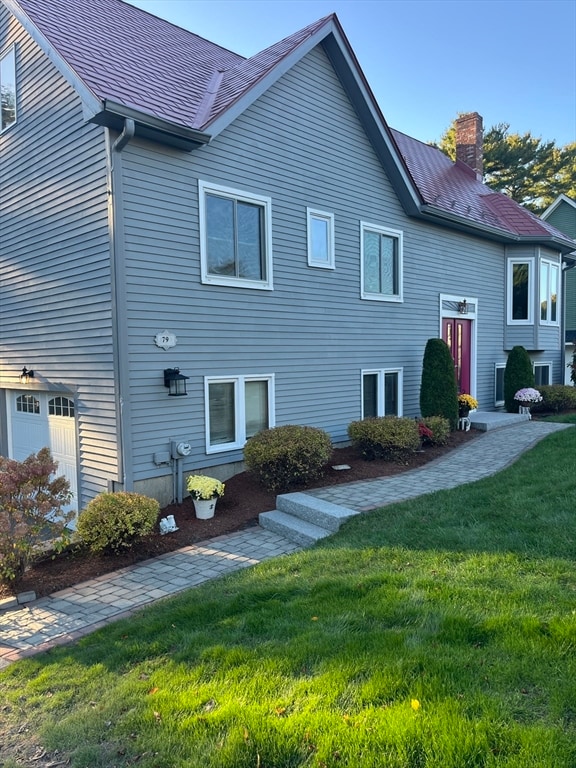
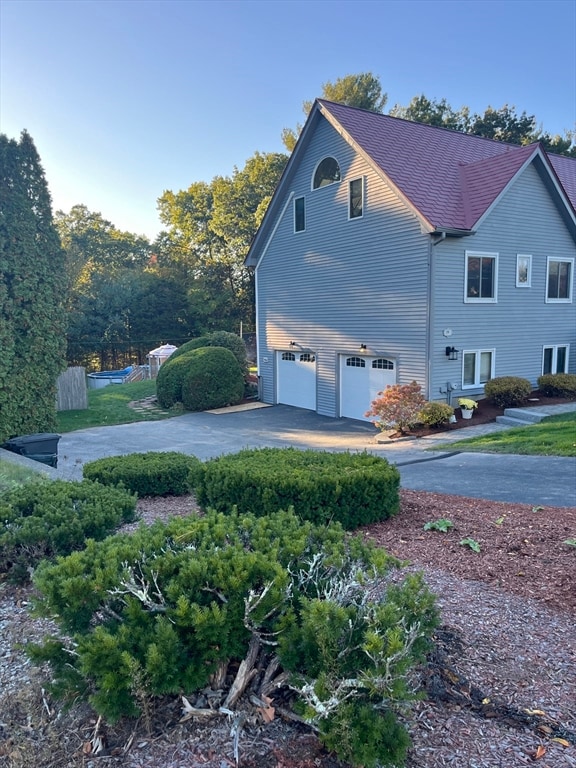
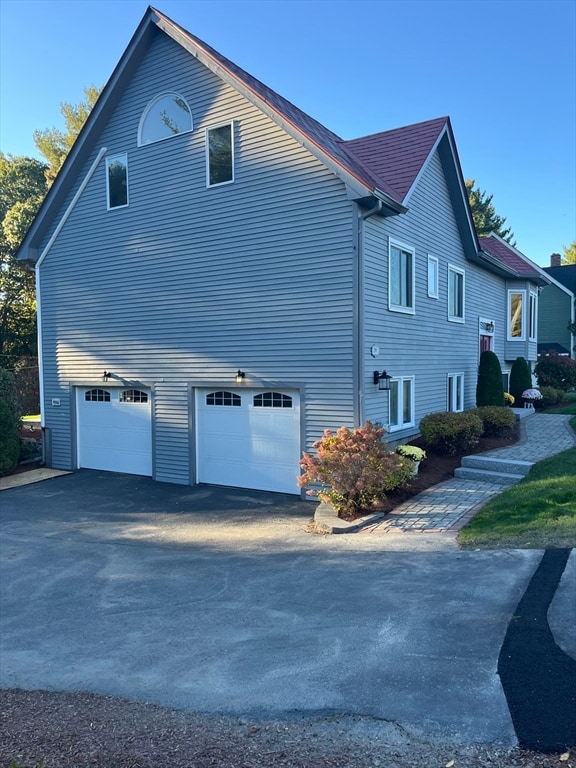
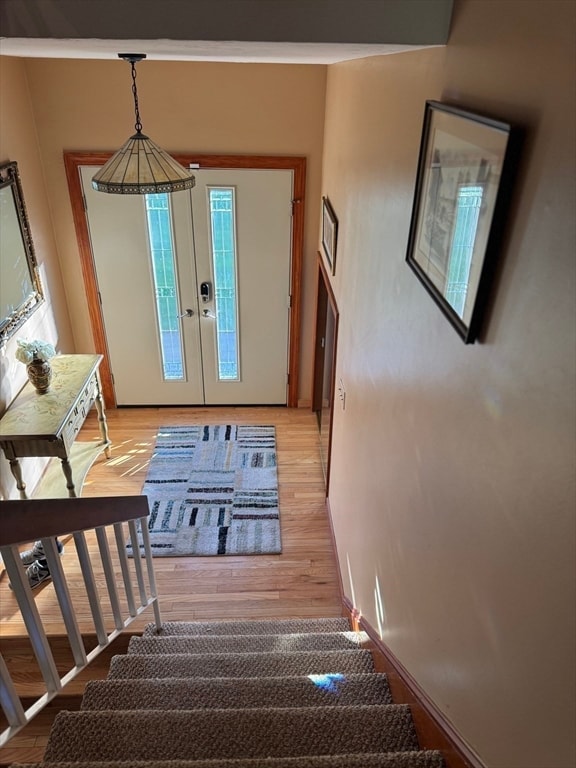
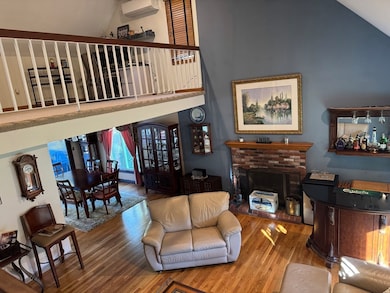
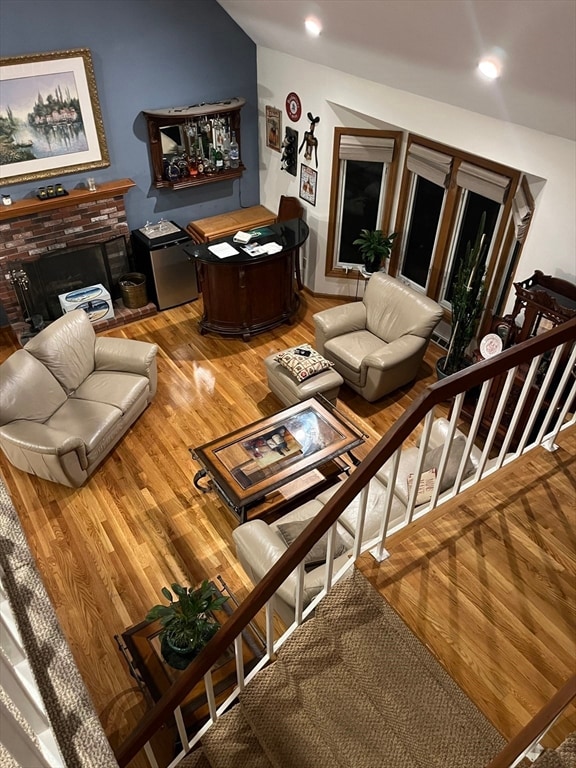
Pride of Ownership for 29+years in this multi-level beautifully maintained and updated family home with a two car"oversized" garage. A bright foyer with staircase to the main level that features open concept fireplaced Living Room, formal Dining Room with slider to a cozy deck for grilling and relaxing. A bright Eat in Kitchen with custom built- ins and SS appliances, also three Bedrooms and two full Bathrooms. The second level features a 30x14 freshly painted Loft/Den w/ a new carpet a great space for playroom, office, TV room, many possibilities. The private Main Bedroom Suite features a walk in dressing room with custom cabinets, Escape in the full Bathroom with jet tub, skylight and shower stall. The natural light from the custom windows and skylights creates a peaceful space to rest, plenty of room for furnishings and more. The huge yard features a large patio w/sunshade, above ground pool with deck, extra large shed,50 yr roof warranty! Min to Rte 138,Easton,Commuter Rail,Stores
Home Details
Home Type
- Single Family
Est. Annual Taxes
- $8,680
Year Built
- Built in 1987
Lot Details
- 0.73 Acre Lot
- Landscaped Professionally
- Level Lot
Parking
- 2 Car Attached Garage
- Tuck Under Parking
- Parking Storage or Cabinetry
- Workshop in Garage
- Garage Door Opener
- Driveway
- Open Parking
- Off-Street Parking
Home Design
- Split Level Home
- Frame Construction
- Metal Roof
- Concrete Perimeter Foundation
Interior Spaces
- Open Floorplan
- Crown Molding
- Coffered Ceiling
- Ceiling Fan
- Skylights
- Recessed Lighting
- Decorative Lighting
- Light Fixtures
- Insulated Windows
- Bay Window
- Picture Window
- Sliding Doors
- Insulated Doors
- Living Room with Fireplace
- Dining Area
- Loft
- Home Security System
Kitchen
- Breakfast Bar
- Oven
- Microwave
- Dishwasher
- Stainless Steel Appliances
- Solid Surface Countertops
- Disposal
Flooring
- Engineered Wood
- Wall to Wall Carpet
- Laminate
- Ceramic Tile
Bedrooms and Bathrooms
- 5 Bedrooms
- Primary bedroom located on second floor
- Custom Closet System
- Dual Closets
- Walk-In Closet
- Dressing Area
- 3 Full Bathrooms
- Double Vanity
- Bathtub with Shower
- Separate Shower
- Linen Closet In Bathroom
Laundry
- Dryer
- Washer
Finished Basement
- Walk-Out Basement
- Basement Fills Entire Space Under The House
- Interior and Exterior Basement Entry
- Garage Access
- Block Basement Construction
- Laundry in Basement
Eco-Friendly Details
- Energy-Efficient Thermostat
- Solar Power System
- Reclaimed Water Irrigation System
Outdoor Features
- Above Ground Pool
- Covered Deck
- Covered Patio or Porch
- Exterior Lighting
- Outdoor Storage
- Outdoor Gas Grill
- Rain Gutters
Location
- Property is near public transit
- Property is near schools
Schools
- South Elementary School
- O'donnell Middle School
- Stoughton High School
Utilities
- Ductless Heating Or Cooling System
- Central Air
- 3 Cooling Zones
- 3 Heating Zones
- Heating System Uses Oil
- Heating System Uses Propane
- Heating System Powered By Leased Propane
- Generator Hookup
- Power Generator
- Water Treatment System
- Private Water Source
- Water Heater
- Water Softener
Listing and Financial Details
- Tax Block 0020
- Assessor Parcel Number 235865
Community Details
Overview
- No Home Owners Association
Amenities
- Medical Services
- Shops
Recreation
- Golf Course Community
Map
Home Values in the Area
Average Home Value in this Area
Tax History
| Year | Tax Paid | Tax Assessment Tax Assessment Total Assessment is a certain percentage of the fair market value that is determined by local assessors to be the total taxable value of land and additions on the property. | Land | Improvement |
|---|---|---|---|---|
| 2025 | $8,680 | $701,100 | $264,400 | $436,700 |
| 2024 | $8,454 | $664,100 | $252,400 | $411,700 |
| 2023 | $8,114 | $598,800 | $216,300 | $382,500 |
| 2022 | $7,606 | $527,800 | $188,300 | $339,500 |
| 2021 | $7,758 | $513,800 | $180,300 | $333,500 |
| 2020 | $7,650 | $513,800 | $180,300 | $333,500 |
| 2019 | $7,296 | $475,600 | $180,300 | $295,300 |
| 2018 | $7,103 | $479,600 | $184,300 | $295,300 |
| 2017 | $6,671 | $460,400 | $184,300 | $276,100 |
| 2016 | $6,338 | $423,400 | $180,300 | $243,100 |
| 2015 | $6,315 | $417,400 | $174,300 | $243,100 |
| 2014 | $5,945 | $377,700 | $152,200 | $225,500 |
Property History
| Date | Event | Price | List to Sale | Price per Sq Ft |
|---|---|---|---|---|
| 11/06/2025 11/06/25 | Pending | -- | -- | -- |
| 10/09/2025 10/09/25 | For Sale | $899,900 | -- | $234 / Sq Ft |
Purchase History
| Date | Type | Sale Price | Title Company |
|---|---|---|---|
| Deed | $169,000 | -- | |
| Deed | $169,000 | -- | |
| Foreclosure Deed | $253,669 | -- | |
| Foreclosure Deed | $253,669 | -- |
Mortgage History
| Date | Status | Loan Amount | Loan Type |
|---|---|---|---|
| Open | $28,000 | No Value Available | |
| Open | $315,000 | No Value Available |
Source: MLS Property Information Network (MLS PIN)
MLS Number: 73442121
APN: STOU-000062-000020
Disclaimer: Certain information contained herein is derived from information provided by parties other than Homes.com. All information provided is deemed reliable, but is not guaranteed to be accurate and should be independently verified.
![]() The property listing data and information, or the Images, set forth herein were provided to MLS Property Information Network, Inc. from third party sources, including sellers, lessors and public records, and were compiled by MLS Property Information Network, Inc. The property listing data and information, and the Images, are for the personal, non-commercial use of consumers having a good faith interest in purchasing or leasing listed properties of the type displayed to them and may not be used for any purpose other than to identify prospective properties which such consumers may have a good faith interest in purchasing or leasing. MLS Property Information Network, Inc. and its subscribers disclaim any and all representations and warranties as to the accuracy of the property listing data and information, or as to the accuracy of any of the Images, set forth herein.
The property listing data and information, or the Images, set forth herein were provided to MLS Property Information Network, Inc. from third party sources, including sellers, lessors and public records, and were compiled by MLS Property Information Network, Inc. The property listing data and information, and the Images, are for the personal, non-commercial use of consumers having a good faith interest in purchasing or leasing listed properties of the type displayed to them and may not be used for any purpose other than to identify prospective properties which such consumers may have a good faith interest in purchasing or leasing. MLS Property Information Network, Inc. and its subscribers disclaim any and all representations and warranties as to the accuracy of the property listing data and information, or as to the accuracy of any of the Images, set forth herein.
- 59 Lucas Dr
- 163 Atkinson Ave
- 93 McEachron Dr
- 48 Sofia Rd
- 40 Anderson Rd
- 511 Sumner St
- 0 Atkinson Ave
- 434 Sumner St
- 386 Morton St
- 38 Brickel Rd
- 20 Washington St Unit 2-8
- 57 Whitney Ave
- 250 Morton St
- 86 Union St
- 110 Union St
- 33 Belmont Ave
- 73 Crescent Ave
- 92 Leah Dr
- 8 Riverside Terrace
- 23 Winterberry Ln
