Estimated Value: $362,000 - $459,000
Studio
--
Bath
2,298
Sq Ft
$176/Sq Ft
Est. Value
About This Home
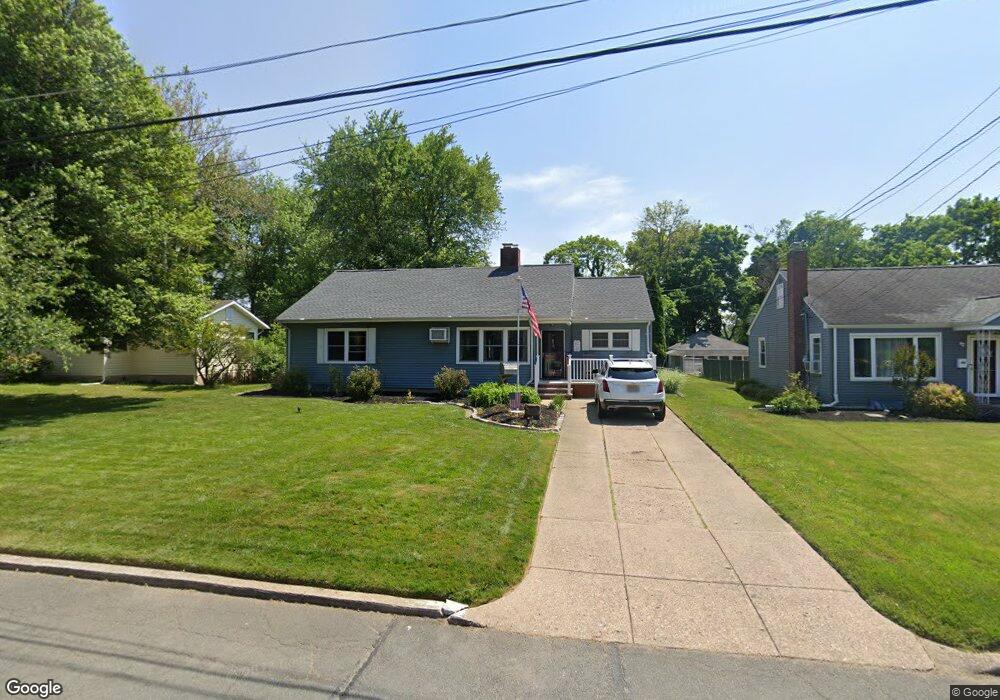
This home is located at 79 Main Blvd, Ewing, NJ 08618 and is currently estimated at $404,187, approximately $175 per square foot. 79 Main Blvd is a home located in Mercer County with nearby schools including Ewing High School, The Village Charter School, and Trenton Stem-To-Civics Charter School.
Ownership History
Date
Name
Owned For
Owner Type
Purchase Details
Closed on
May 30, 2000
Sold by
Watkinson Brian
Bought by
Leary Sean and Fausnaugh Peggy
Current Estimated Value
Home Financials for this Owner
Home Financials are based on the most recent Mortgage that was taken out on this home.
Original Mortgage
$129,527
Outstanding Balance
$46,574
Interest Rate
8.5%
Mortgage Type
FHA
Estimated Equity
$357,613
Purchase Details
Closed on
Dec 27, 1991
Sold by
Cullen Daniel F and Cullen Patricia B
Bought by
Watkinson Brian D and Watkinson Joan P
Create a Home Valuation Report for This Property
The Home Valuation Report is an in-depth analysis detailing your home's value as well as a comparison with similar homes in the area
Home Values in the Area
Average Home Value in this Area
Purchase History
| Date | Buyer | Sale Price | Title Company |
|---|---|---|---|
| Leary Sean | $135,000 | -- | |
| Watkinson Brian D | $123,600 | -- |
Source: Public Records
Mortgage History
| Date | Status | Borrower | Loan Amount |
|---|---|---|---|
| Open | Leary Sean | $129,527 |
Source: Public Records
Tax History
| Year | Tax Paid | Tax Assessment Tax Assessment Total Assessment is a certain percentage of the fair market value that is determined by local assessors to be the total taxable value of land and additions on the property. | Land | Improvement |
|---|---|---|---|---|
| 2025 | $9,333 | $237,300 | $53,400 | $183,900 |
| 2024 | $8,773 | $237,300 | $53,400 | $183,900 |
Source: Public Records
Map
Nearby Homes
- 41 Harding St
- 71 Carlton Ave
- 1060 Terrace Blvd
- 37 van Duyn Dr
- 20 Steinway Ave
- 126 Rutledge Ave
- 21 Dixmont Ave
- 33 Stratford Ave
- 51 van Duyn Dr
- 6 Van Gogh Ct
- 161 Louisiana Ave
- 89 Upper Ferry Rd
- 107 Kyle Way
- 18 Kyle Way
- 121 Kyle Way
- 59 Kyle Way
- 146 Masterson Ct
- 140 Crescent Ave
- 37 Central Ave
- 235 Masterson Ct
Your Personal Tour Guide
Ask me questions while you tour the home.