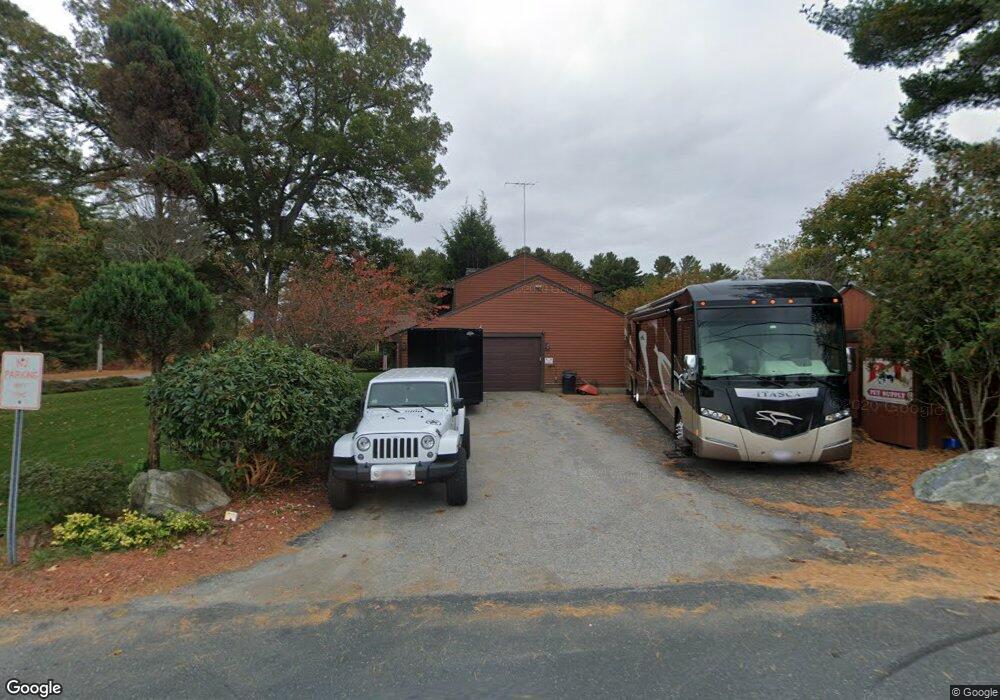
79 Main St Oxford, MA 01540
Estimated Value: $513,872 - $604,000
3
Beds
2
Baths
2,212
Sq Ft
$251/Sq Ft
Est. Value
About This Home
This home is located at 79 Main St, Oxford, MA 01540 and is currently estimated at $556,218, approximately $251 per square foot. 79 Main St is a home located in Worcester County with nearby schools including Alfred M Chaffee, Oxford High School, and Clara Barton Elementary School.
Ownership History
Date
Name
Owned For
Owner Type
Purchase Details
Closed on
Mar 18, 2015
Sold by
Yukavich-Degaetano Y
Bought by
Degaetano Yolanda J and Degaetano Michael
Current Estimated Value
Home Financials for this Owner
Home Financials are based on the most recent Mortgage that was taken out on this home.
Original Mortgage
$256,867
Outstanding Balance
$196,152
Interest Rate
3.6%
Mortgage Type
FHA
Estimated Equity
$360,066
Purchase Details
Closed on
Jul 31, 2003
Sold by
Chausse Lisa M and Thibeault-Gardner Lisa M
Bought by
Degaetano Yolanda J and Degaetano Yukavich-Degaetano Y
Create a Home Valuation Report for This Property
The Home Valuation Report is an in-depth analysis detailing your home's value as well as a comparison with similar homes in the area
Home Values in the Area
Average Home Value in this Area
Purchase History
| Date | Buyer | Sale Price | Title Company |
|---|---|---|---|
| Degaetano Yolanda J | -- | -- | |
| Degaetano Yolanda J | $295,000 | -- |
Source: Public Records
Mortgage History
| Date | Status | Borrower | Loan Amount |
|---|---|---|---|
| Open | Degaetano Yolanda J | $256,867 |
Source: Public Records
Tax History Compared to Growth
Tax History
| Year | Tax Paid | Tax Assessment Tax Assessment Total Assessment is a certain percentage of the fair market value that is determined by local assessors to be the total taxable value of land and additions on the property. | Land | Improvement |
|---|---|---|---|---|
| 2025 | $59 | $469,500 | $95,100 | $374,400 |
| 2024 | $5,829 | $432,400 | $88,400 | $344,000 |
| 2023 | $5,328 | $390,600 | $78,900 | $311,700 |
| 2022 | $5,323 | $329,400 | $67,200 | $262,200 |
| 2021 | $5,146 | $311,300 | $63,700 | $247,600 |
| 2020 | $4,971 | $298,400 | $63,700 | $234,700 |
| 2019 | $4,659 | $273,600 | $63,500 | $210,100 |
| 2018 | $4,435 | $256,800 | $63,500 | $193,300 |
| 2017 | $4,442 | $263,600 | $63,500 | $200,100 |
| 2016 | $4,463 | $263,600 | $63,500 | $200,100 |
| 2015 | $4,162 | $263,600 | $63,500 | $200,100 |
| 2014 | $4,092 | $272,800 | $63,500 | $209,300 |
Source: Public Records
Map
Nearby Homes