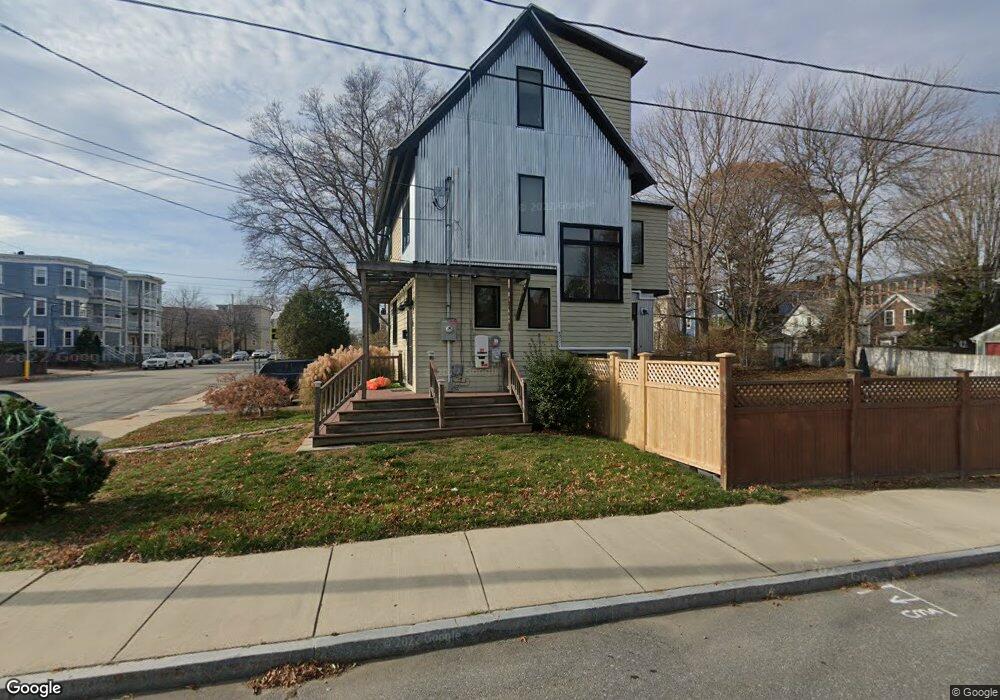
79 Market St Unit 1 Lawrence, MA 01843
South Common NeighborhoodEstimated Value: $526,000 - $576,806
2
Beds
3
Baths
1,500
Sq Ft
$373/Sq Ft
Est. Value
About This Home
This home is located at 79 Market St Unit 1, Lawrence, MA 01843 and is currently estimated at $558,952, approximately $372 per square foot. 79 Market St Unit 1 is a home located in Essex County with nearby schools including Vardaman Elementary School, Olive Branch Elementary School, and Rowan Elementary School.
Ownership History
Date
Name
Owned For
Owner Type
Purchase Details
Closed on
Jan 9, 2015
Sold by
Simari Christopher
Bought by
Morales Judith
Current Estimated Value
Home Financials for this Owner
Home Financials are based on the most recent Mortgage that was taken out on this home.
Original Mortgage
$237,650
Outstanding Balance
$183,032
Interest Rate
3.99%
Mortgage Type
New Conventional
Estimated Equity
$375,920
Purchase Details
Closed on
Jan 13, 2010
Sold by
79 Market Street Llc
Bought by
Simari Christopher
Home Financials for this Owner
Home Financials are based on the most recent Mortgage that was taken out on this home.
Original Mortgage
$202,177
Interest Rate
4.62%
Mortgage Type
FHA
Purchase Details
Closed on
Aug 16, 2007
Sold by
Powerhouse Ent Inc
Bought by
79 Market Street Llc
Purchase Details
Closed on
Jul 30, 2007
Sold by
Lawrence City Of
Bought by
Powerhouse Ent Inc
Create a Home Valuation Report for This Property
The Home Valuation Report is an in-depth analysis detailing your home's value as well as a comparison with similar homes in the area
Home Values in the Area
Average Home Value in this Area
Purchase History
| Date | Buyer | Sale Price | Title Company |
|---|---|---|---|
| Morales Judith | $245,000 | -- | |
| Simari Christopher | $206,000 | -- | |
| 79 Market Street Llc | $11,000 | -- | |
| Powerhouse Ent Inc | $11,000 | -- |
Source: Public Records
Mortgage History
| Date | Status | Borrower | Loan Amount |
|---|---|---|---|
| Open | Morales Judith | $237,650 | |
| Previous Owner | Simari Christopher | $202,177 |
Source: Public Records
Tax History Compared to Growth
Tax History
| Year | Tax Paid | Tax Assessment Tax Assessment Total Assessment is a certain percentage of the fair market value that is determined by local assessors to be the total taxable value of land and additions on the property. | Land | Improvement |
|---|---|---|---|---|
| 2025 | $3,573 | $406,000 | $109,600 | $296,400 |
| 2024 | $3,814 | $412,300 | $118,600 | $293,700 |
| 2023 | $4,050 | $398,600 | $110,000 | $288,600 |
| 2022 | $3,926 | $343,200 | $99,600 | $243,600 |
| 2021 | $3,760 | $306,400 | $99,600 | $206,800 |
| 2020 | $3,439 | $276,700 | $94,500 | $182,200 |
| 2019 | $3,912 | $286,000 | $78,500 | $207,500 |
| 2018 | $3,613 | $252,300 | $74,400 | $177,900 |
| 2017 | $3,562 | $232,200 | $70,200 | $162,000 |
| 2016 | $3,476 | $224,100 | $57,800 | $166,300 |
| 2015 | $3,388 | $224,100 | $57,800 | $166,300 |
Source: Public Records
Map
Nearby Homes
- 80 Market St
- 46 Loring St
- 4 Shawsheen Rd Unit 2
- 77-79 Shawsheen Rd
- 64 Salem St
- 67-69 Osgood St
- 78-80 Osgood St
- 75 Beverly St Unit 75
- 317 Middlesex St
- 68 Union St
- 127 Marblehead St Unit A
- 7 Stevens Ct
- 52 Howard St
- 91 Farnham St
- 57 Glenwood St
- 19-21 Pleasant Terrace
- 356-360 S Union St
- 42 Union St
- 32 Orchard St
- 27-29 Dorchester St
- 79 Market St
- 83 Market St Unit 85
- 9 Temple St Unit 11
- 12 Temple St Unit 14
- 23 Portland St Unit 25
- 71 Market St
- 89 Market St
- 21 Portland St
- 76 Market St
- 84 Market St
- 32 Portland St
- 19 Portland St
- 88 Market St
- 72 Market St
- 91 Market St
- 57 Market St
- 92 Market St
- 94 Market St Unit 96
- 90-92 Market St
- 68 Market St