79 Marsh Rd Pelham, NH 03076
Pelham AreaEstimated Value: $783,000 - $965,000
About This Home
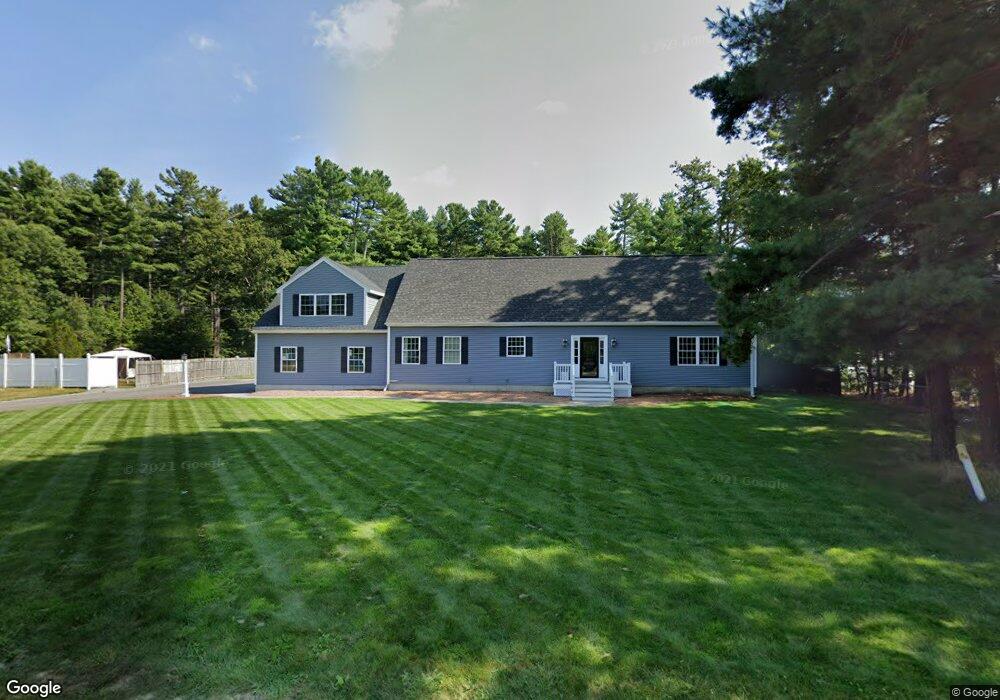
This home is located at 79 Marsh Rd, Pelham, NH 03076 and is currently estimated at $887,119, approximately $337 per square foot. 79 Marsh Rd is a home located in Hillsborough County with nearby schools including Pelham Elementary School, Pelham Memorial School, and Pelham High School.
Ownership History
We collect this data history from publicly available records. To have your information removed, we recommend requesting removal directly through your county’s website.
Purchase Details
Home Financials for this Owner
Home Financials are based on the most recent Mortgage that was taken out on this home.Purchase Details
Purchase Details
Purchase Details
Home Values in the Area
Average Home Value in this Area
Purchase History
We collect this data history from publicly available records. To have your information removed, we recommend requesting removal directly through your county’s website.
| Date | Buyer | Sale Price | Title Company |
|---|---|---|---|
| $203,100 | -- | ||
| -- | -- | ||
| $249,800 | -- | ||
| $170,000 | -- |
Mortgage History
We collect this data history from publicly available records. To have your information removed, we recommend requesting removal directly through your county’s website.
| Date | Status | Borrower | Loan Amount |
|---|---|---|---|
| Open | $201,000 | ||
| Closed | $180,160 | ||
| Previous Owner | $346,612 | ||
| Closed | $333,600 | ||
| Closed | $26,100 |
Tax History
We collect this data history from publicly available records. To have your information removed, we recommend requesting removal directly through your county’s website.
| Year | Tax Paid | Tax Assessment Tax Assessment Total Assessment is a certain percentage of the fair market value that is determined by local assessors to be the total taxable value of land and additions on the property. | Land | Improvement |
|---|---|---|---|---|
| 2025 | $12,365 | $647,700 | $150,600 | $497,100 |
| 2024 | $10,511 | $573,100 | $150,600 | $422,500 |
| 2023 | $10,425 | $573,100 | $150,600 | $422,500 |
| 2022 | $9,983 | $573,100 | $150,600 | $422,500 |
| 2021 | $9,147 | $573,100 | $150,600 | $422,500 |
| 2020 | $8,718 | $431,600 | $120,300 | $311,300 |
| 2019 | $8,757 | $451,400 | $120,300 | $331,100 |
| 2018 | $8,796 | $409,900 | $120,300 | $289,600 |
| 2017 | $8,792 | $409,900 | $120,300 | $289,600 |
| 2016 | $8,587 | $409,900 | $120,300 | $289,600 |
| 2015 | $7,871 | $338,400 | $114,300 | $224,100 |
| 2014 | $7,739 | $338,400 | $114,300 | $224,100 |
| 2013 | $8,569 | $374,700 | $114,300 | $260,400 |
Map
- 5 Lisa Terrace
- 17 Newbury Rd
- 27 Haystack Cir
- 4 Haystack Cir
- 6 Hickory Hill Rd
- 4 Jennifer Dr
- 4 Beaver Brook Way Unit B
- 31 Leonard Dr
- 10 Oakland Ridge Rd Unit 11
- 25 Fletcher Dr
- 8 Island Pond Rd
- 4 Rita Ave
- 22 Clark Cir
- 0 Bridge St Unit 320
- 79 Wyndridge Cir
- 770 Mammoth Rd
- 31 Pasture Ln
- 773 Mammoth Rd
- 108 Sky View Dr
- 190 Wyndridge Cir
Ask me questions while you tour the home.