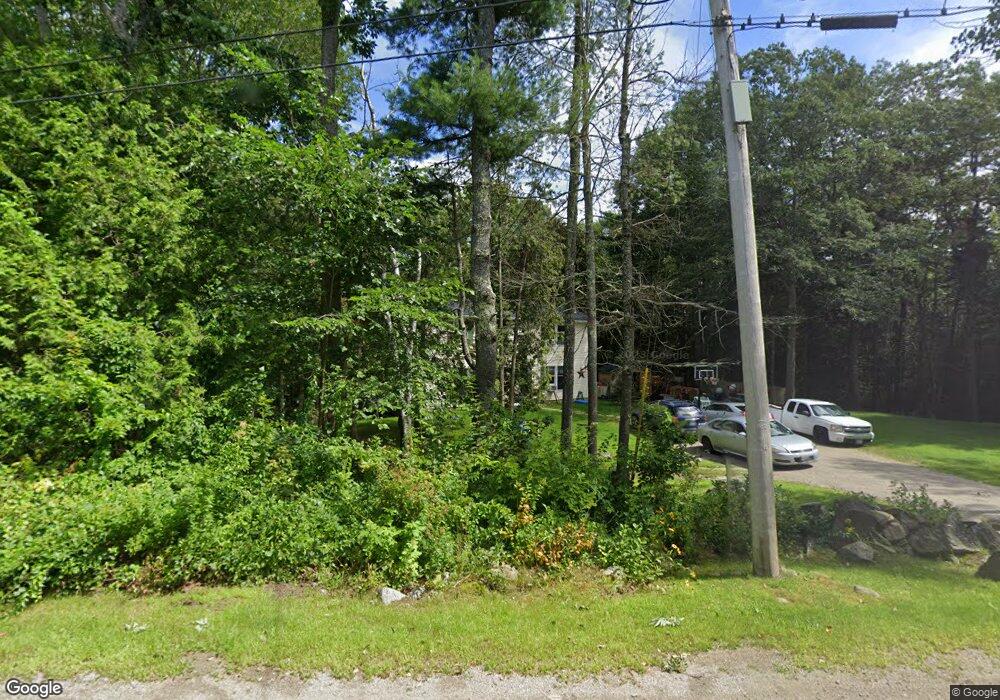
79 Middle Rd Edgecomb, ME 04556
Estimated Value: $412,000 - $673,000
3
Beds
3
Baths
2,112
Sq Ft
$239/Sq Ft
Est. Value
About This Home
This home is located at 79 Middle Rd, Edgecomb, ME 04556 and is currently estimated at $504,596, approximately $238 per square foot. 79 Middle Rd is a home located in Lincoln County with nearby schools including Edgecomb Eddy School, Center for Teaching & Learning, and The Deck House School.
Ownership History
Date
Name
Owned For
Owner Type
Purchase Details
Closed on
May 14, 2021
Sold by
Mid Me Re Llc
Bought by
Hyson Evan
Current Estimated Value
Home Financials for this Owner
Home Financials are based on the most recent Mortgage that was taken out on this home.
Original Mortgage
$192,443
Outstanding Balance
$173,658
Interest Rate
3.1%
Mortgage Type
FHA
Estimated Equity
$330,938
Purchase Details
Closed on
Aug 1, 2008
Sold by
Cost Dorothy B Est and Bedore
Bought by
Harris Val R and Harris Marilee A
Home Financials for this Owner
Home Financials are based on the most recent Mortgage that was taken out on this home.
Original Mortgage
$159,693
Interest Rate
6.47%
Mortgage Type
FHA
Create a Home Valuation Report for This Property
The Home Valuation Report is an in-depth analysis detailing your home's value as well as a comparison with similar homes in the area
Home Values in the Area
Average Home Value in this Area
Purchase History
| Date | Buyer | Sale Price | Title Company |
|---|---|---|---|
| Hyson Evan | -- | None Available | |
| Hyson Evan | -- | None Available | |
| Harris Val R | -- | -- | |
| Harris Val R | -- | -- | |
| Harris Val R | -- | -- |
Source: Public Records
Mortgage History
| Date | Status | Borrower | Loan Amount |
|---|---|---|---|
| Open | Hyson Evan | $192,443 | |
| Closed | Hyson Evan | $192,443 | |
| Previous Owner | Harris Val R | $159,693 |
Source: Public Records
Tax History Compared to Growth
Tax History
| Year | Tax Paid | Tax Assessment Tax Assessment Total Assessment is a certain percentage of the fair market value that is determined by local assessors to be the total taxable value of land and additions on the property. | Land | Improvement |
|---|---|---|---|---|
| 2024 | $3,801 | $172,937 | $46,000 | $126,937 |
| 2023 | $2,888 | $172,937 | $46,000 | $126,937 |
| 2022 | $2,793 | $172,937 | $46,000 | $126,937 |
| 2021 | $3,018 | $172,937 | $46,000 | $126,937 |
| 2020 | $3,102 | $172,937 | $46,000 | $126,937 |
| 2019 | $3,211 | $172,937 | $46,000 | $126,937 |
| 2018 | $2,957 | $172,937 | $46,000 | $126,937 |
| 2017 | $2,902 | $172,937 | $46,000 | $126,937 |
| 2015 | $2,629 | $172,937 | $46,000 | $126,937 |
| 2013 | $2,274 | $172,937 | $46,000 | $126,937 |
Source: Public Records
Map
Nearby Homes
- 00 Maine 27
- 664 Boothbay Rd
- 52 Eddy Rd
- 29 Mill Rd
- 27 Dodge Rd
- 67 Village Way Unit 505
- 91 Lord Rd
- 50 Bunchberry Ln
- 34 Bunchberry Ln
- 48 Us Route 1
- Lot #3 Bay View Trail
- 304 Eddy Rd Unit 216
- 11 Island Ln Unit 1
- 114 Fort Rd
- 306 Eddy Rd Unit 310
- 306 Eddy Rd Unit 307
- 306 Eddy Rd Unit 309
- Lot#4 Bay View Trail
- 9 Tomcat Trail
- 29 Wiscasset Rd