Estimated Value: $229,121 - $258,000
3
Beds
2
Baths
1,344
Sq Ft
$182/Sq Ft
Est. Value
About This Home
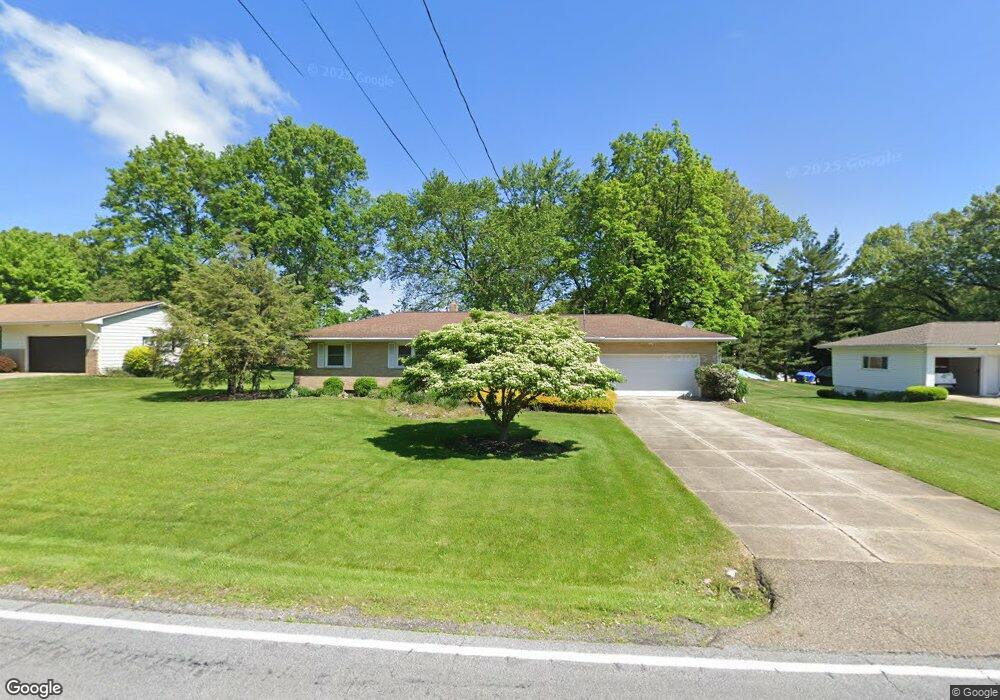
This home is located at 79 Moore Rd, Akron, OH 44319 and is currently estimated at $245,030, approximately $182 per square foot. 79 Moore Rd is a home located in Summit County with nearby schools including Greenwood Elementary School, Green Intermediate Elementary School, and Green Primary School.
Ownership History
Date
Name
Owned For
Owner Type
Purchase Details
Closed on
Sep 1, 2011
Sold by
Richards Margaret M
Bought by
Richards Margaret and The Margaret Richards Living Trust
Current Estimated Value
Purchase Details
Closed on
Oct 23, 2006
Sold by
Smith Charles J
Bought by
Richards Margaret M
Home Financials for this Owner
Home Financials are based on the most recent Mortgage that was taken out on this home.
Original Mortgage
$124,000
Outstanding Balance
$74,157
Interest Rate
6.5%
Mortgage Type
Purchase Money Mortgage
Estimated Equity
$170,873
Create a Home Valuation Report for This Property
The Home Valuation Report is an in-depth analysis detailing your home's value as well as a comparison with similar homes in the area
Purchase History
| Date | Buyer | Sale Price | Title Company |
|---|---|---|---|
| Richards Margaret | -- | Attorney | |
| Richards Margaret M | $155,000 | First American Title Ins Co |
Source: Public Records
Mortgage History
| Date | Status | Borrower | Loan Amount |
|---|---|---|---|
| Open | Richards Margaret M | $124,000 |
Source: Public Records
Tax History
| Year | Tax Paid | Tax Assessment Tax Assessment Total Assessment is a certain percentage of the fair market value that is determined by local assessors to be the total taxable value of land and additions on the property. | Land | Improvement |
|---|---|---|---|---|
| 2024 | $3,191 | $65,944 | $11,802 | $54,142 |
| 2023 | $3,191 | $65,944 | $11,802 | $54,142 |
| 2022 | $2,691 | $49,960 | $8,943 | $41,017 |
| 2021 | $2,528 | $49,960 | $8,943 | $41,017 |
| 2020 | $2,480 | $49,960 | $8,940 | $41,020 |
| 2019 | $2,267 | $42,770 | $7,820 | $34,950 |
| 2018 | $2,319 | $42,770 | $7,820 | $34,950 |
| 2017 | $2,498 | $42,770 | $7,820 | $34,950 |
| 2016 | $2,458 | $42,770 | $7,820 | $34,950 |
| 2015 | $2,498 | $42,770 | $7,820 | $34,950 |
| 2014 | $2,481 | $42,770 | $7,820 | $34,950 |
| 2013 | $2,628 | $45,100 | $7,820 | $37,280 |
Source: Public Records
Map
Nearby Homes
- 3785 S Main St
- 68 Starboard Cir
- 221 Lake Front Dr
- 397 Wonder Lake Dr
- 277 Lake Front Dr
- 76 Forest Mill Ln
- 3809 N Glenridge Rd
- 308 E Vista Ave
- 222 Olden Ave
- 3812 N Glenridge Rd
- 265 E Pace Ave
- 4298 S Main St Unit 4302
- 3273 S Jasmine Ave
- 4135 State Park Dr
- 619 Moore Rd
- 347 Dorwil Dr
- 570 E Turkeyfoot Lake Rd
- 4387 Point Comfort Dr
- 3085 Daisy Ave
- 556 Kruger Ave
Your Personal Tour Guide
Ask me questions while you tour the home.