
Seller's Agent in 2023
Fabilene Neves
Century 21 North East
(508) 851-0334
2 in this area
52 Total Sales

Estimated Value: $1,702,000 - $2,038,000
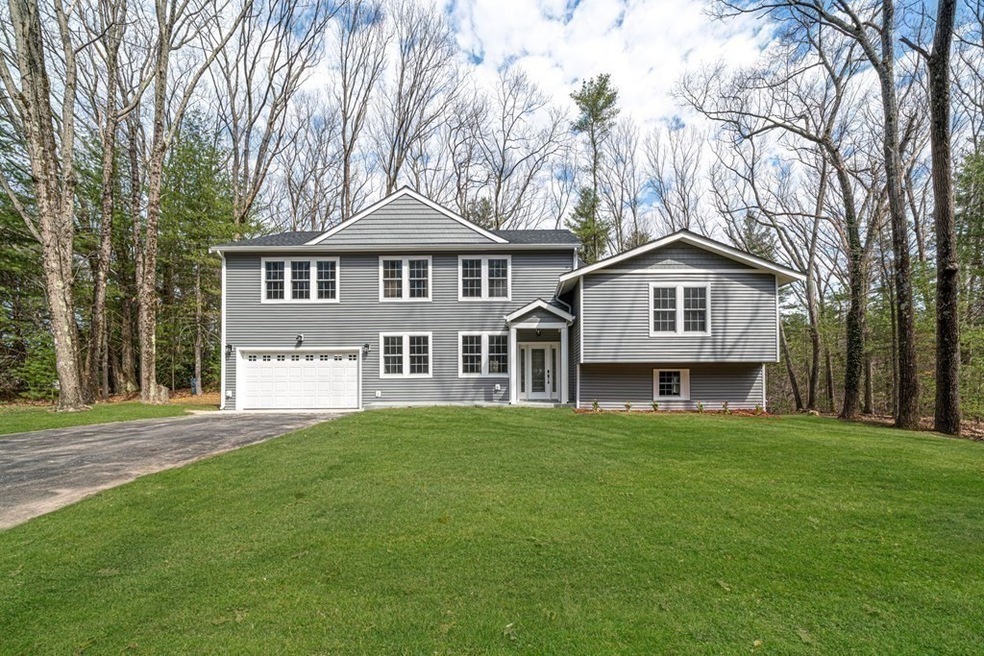
Find total serenity in this meticulously remodeled Contemporary Home. The architecture and interior design focus blend interior space with the outdoors capturing the landscape to create a seamless, continuous, Luxury Living Space. A formal living room adorned Fireplace & coffered ceilings and windows with french door access to the rear decks surrounding the Eat-in kitchen’s banquette seating. The Second Floor features a Primary Luxurious suite that boasts corner exposure with a walk-in closet, en suite bath, and additional 2nd and 3rd, and 4th suite bedrooms. Multi-levels create separate Living and Entertaining areas, including unsurpassed studio and recreation space, which are subtly weaved into the design to give depth while never compromising the fluidity of this home. Multiple home office options with separate entrances allow one to work from home efficiently. Spacious laundry, copious storage room. Two-car garage, circle driveway in a quiet dead-end road.
| Date | Buyer | Sale Price | Title Company |
|---|---|---|---|
| Neelima Krishna Ft | -- | -- | |
| Konda Krishna | $1,710,000 | None Available | |
| Excellence Dev Co Llc | $780,000 | None Available | |
| Betty T Lowry Ret | -- | -- | |
| Betty T Lowry Ret | -- | -- |
| Date | Status | Borrower | Loan Amount |
|---|---|---|---|
| Previous Owner | Konda Krishna | $1,368,000 | |
| Previous Owner | Excellence Dev Co Llc | $951,000 |
| Date | Event | Price | List to Sale | Price per Sq Ft | Prior Sale |
|---|---|---|---|---|---|
| 06/16/2023 06/16/23 | Sold | $1,710,000 | -2.3% | $407 / Sq Ft | |
| 05/15/2023 05/15/23 | Pending | -- | -- | -- | |
| 03/31/2023 03/31/23 | For Sale | $1,750,000 | +124.4% | $417 / Sq Ft | |
| 07/15/2022 07/15/22 | Sold | $780,000 | +14.9% | $344 / Sq Ft | View Prior Sale |
| 05/16/2022 05/16/22 | Pending | -- | -- | -- | |
| 05/13/2022 05/13/22 | For Sale | $679,000 | -- | $299 / Sq Ft |
| Year | Tax Paid | Tax Assessment Tax Assessment Total Assessment is a certain percentage of the fair market value that is determined by local assessors to be the total taxable value of land and additions on the property. | Land | Improvement |
|---|---|---|---|---|
| 2025 | $25,282 | $1,617,500 | $622,200 | $995,300 |
| 2024 | $29,105 | $1,875,300 | $592,600 | $1,282,700 |
| 2023 | $14,332 | $860,800 | $538,600 | $322,200 |
| 2022 | $13,614 | $741,900 | $446,000 | $295,900 |
| 2021 | $12,816 | $692,000 | $405,500 | $286,500 |
| 2020 | $12,423 | $699,500 | $405,500 | $294,000 |
| 2019 | $12,162 | $665,300 | $386,300 | $279,000 |
| 2018 | $11,216 | $622,100 | $386,300 | $235,800 |
| 2017 | $11,006 | $606,700 | $374,600 | $232,100 |
| 2016 | $10,198 | $588,100 | $367,200 | $220,900 |
| 2015 | $10,712 | $582,500 | $367,200 | $215,300 |
Seller's Agent in 2023
Fabilene Neves
Century 21 North East
(508) 851-0334
2 in this area
52 Total Sales
Buyer's Agent in 2023
Ana Andreev
Compass
(617) 458-2599
1 in this area
27 Total Sales
Seller's Agent in 2022
Doug McNeilly
Coldwell Banker Realty - Sudbury
(857) 233-3295
7 in this area
43 Total Sales
Source: MLS Property Information Network (MLS PIN)
MLS Number: 73093794
APN: WAYL-000011-000000-000011
Disclaimer: Certain information contained herein is derived from information provided by parties other than Homes.com. All information provided is deemed reliable, but is not guaranteed to be accurate and should be independently verified.
![]() The property listing data and information, or the Images, set forth herein were provided to MLS Property Information Network, Inc. from third party sources, including sellers, lessors and public records, and were compiled by MLS Property Information Network, Inc. The property listing data and information, and the Images, are for the personal, non-commercial use of consumers having a good faith interest in purchasing or leasing listed properties of the type displayed to them and may not be used for any purpose other than to identify prospective properties which such consumers may have a good faith interest in purchasing or leasing. MLS Property Information Network, Inc. and its subscribers disclaim any and all representations and warranties as to the accuracy of the property listing data and information, or as to the accuracy of any of the Images, set forth herein.
The property listing data and information, or the Images, set forth herein were provided to MLS Property Information Network, Inc. from third party sources, including sellers, lessors and public records, and were compiled by MLS Property Information Network, Inc. The property listing data and information, and the Images, are for the personal, non-commercial use of consumers having a good faith interest in purchasing or leasing listed properties of the type displayed to them and may not be used for any purpose other than to identify prospective properties which such consumers may have a good faith interest in purchasing or leasing. MLS Property Information Network, Inc. and its subscribers disclaim any and all representations and warranties as to the accuracy of the property listing data and information, or as to the accuracy of any of the Images, set forth herein.
Ask me questions while you tour the home.