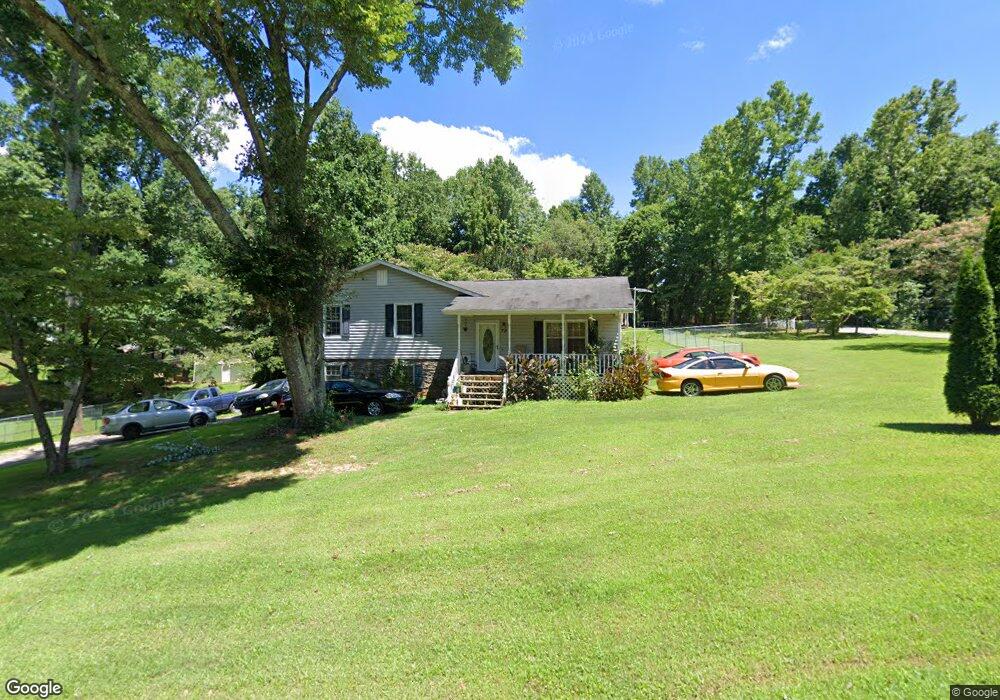
79 Mountain View Dr Jasper, GA 30143
Estimated Value: $146,180 - $260,000
Studio
1
Bath
1,104
Sq Ft
$204/Sq Ft
Est. Value
About This Home
This home is located at 79 Mountain View Dr, Jasper, GA 30143 and is currently estimated at $225,295, approximately $204 per square foot. 79 Mountain View Dr is a home located in Pickens County with nearby schools including Harmony Elementary School, Pickens County Middle School, and Pickens County High School.
Ownership History
Date
Name
Owned For
Owner Type
Purchase Details
Closed on
Nov 24, 2014
Sold by
Dunn Robin W and Dunn Kathleen J
Bought by
Gratcyk Karen E
Current Estimated Value
Home Financials for this Owner
Home Financials are based on the most recent Mortgage that was taken out on this home.
Original Mortgage
$92,346
Outstanding Balance
$70,197
Interest Rate
3.95%
Mortgage Type
New Conventional
Estimated Equity
$155,098
Purchase Details
Closed on
Sep 26, 2005
Sold by
Powers Steven L
Bought by
Dunn Robin W and Dunn Kathleen J
Home Financials for this Owner
Home Financials are based on the most recent Mortgage that was taken out on this home.
Original Mortgage
$100,800
Interest Rate
5.72%
Mortgage Type
New Conventional
Purchase Details
Closed on
Jul 25, 2003
Sold by
Lewis Rodney J
Bought by
Powers Steven L
Purchase Details
Closed on
Jun 3, 1999
Sold by
Cox Ricky and Cox Tammy S
Bought by
Lewis Rodney J
Purchase Details
Closed on
May 5, 1995
Bought by
Cox Ricky and Cox Tammy S
Purchase Details
Closed on
Apr 27, 1987
Sold by
Dunn Robin W and Dunn Kathleen J
Bought by
Cox Ricky and Cox Tammy S
Purchase Details
Closed on
Jan 1, 1981
Sold by
Dunn Robin W and Dunn Kathleen J
Bought by
Cox Ricky
Create a Home Valuation Report for This Property
The Home Valuation Report is an in-depth analysis detailing your home's value as well as a comparison with similar homes in the area
Home Values in the Area
Average Home Value in this Area
Purchase History
| Date | Buyer | Sale Price | Title Company |
|---|---|---|---|
| Gratcyk Karen E | $90,500 | -- | |
| Dunn Robin W | $112,000 | -- | |
| Dunn Robin W | $112,000 | -- | |
| Powers Steven L | $90,000 | -- | |
| Lewis Rodney J | $69,500 | -- | |
| Cox Ricky | -- | -- | |
| Cox Ricky | -- | -- | |
| Cox Ricky | $34,500 | -- |
Source: Public Records
Mortgage History
| Date | Status | Borrower | Loan Amount |
|---|---|---|---|
| Open | Gratcyk Karen E | $92,346 | |
| Previous Owner | Dunn Robin W | $100,800 |
Source: Public Records
Tax History
| Year | Tax Paid | Tax Assessment Tax Assessment Total Assessment is a certain percentage of the fair market value that is determined by local assessors to be the total taxable value of land and additions on the property. | Land | Improvement |
|---|---|---|---|---|
| 2025 | $757 | $41,811 | $12,000 | $29,811 |
| 2024 | $827 | $41,811 | $12,000 | $29,811 |
| 2023 | $850 | $41,811 | $12,000 | $29,811 |
| 2022 | $850 | $41,811 | $12,000 | $29,811 |
| 2021 | $911 | $41,811 | $12,000 | $29,811 |
| 2020 | $852 | $37,971 | $8,160 | $29,811 |
| 2019 | $872 | $37,971 | $8,160 | $29,811 |
| 2018 | $880 | $37,971 | $8,160 | $29,811 |
| 2017 | $894 | $37,971 | $8,160 | $29,811 |
| 2016 | $909 | $37,971 | $8,160 | $29,811 |
| 2015 | $846 | $28,422 | $7,778 | $28,422 |
| 2014 | $889 | $37,971 | $8,160 | $29,811 |
| 2013 | -- | $37,971 | $8,160 | $29,811 |
Source: Public Records
Map
Nearby Homes
- 324 Northside Dr
- 7 Noah Dr
- 130 Rolling Meadow Trace
- 224 Deerberry Dr
- 214 Deerberry Dr
- 206 Deerberry Dr
- 43 Rolling Meadow Trace
- 33 Rolling Meadow
- 33 Rolling Meadow Trace
- 27 Rolling Meadow Trace
- 27 Rolling Meadow
- 65 Lindsey Ln
- 91 Pinnacle Way
- 10 Kane Dr
- 733 Gennett Dr
- 29 Arbor Hills Trace
- 12 Sammy McGhee Blvd Unit 203
- 174 Golden Springs Dr
- 341 Hood Park Dr
- 378 Hood Park Dr
- 80 Mountain View Cir
- 80 Mountain View Cir
- 0 Mountain View Dr Unit 7020261
- 0 Mountain View Dr Unit L12/13 8782075
- 80 Mountain View Cir
- 0 Mountain View Dr Unit 3149201
- 51 Mountain View Dr
- 92 Mountain View Dr
- 80 Mountain View Dr
- 105 Mountain View Dr
- 66 Mountain View Dr
- L12/13 Mountain View Cir
- 94 Mountain View Dr
- 75 Mountain View Dr
- 35 Mountain View Dr
- 52 Mountain View Dr
- 106 Mountain View Dr
- 56 Mountain View Cir
- 117 Mountain View Dr
- 68 Mckenzie Blvd Unit 68
Your Personal Tour Guide
Ask me questions while you tour the home.