Estimated Value: $335,000 - $369,000
3
Beds
1
Bath
1,156
Sq Ft
$305/Sq Ft
Est. Value
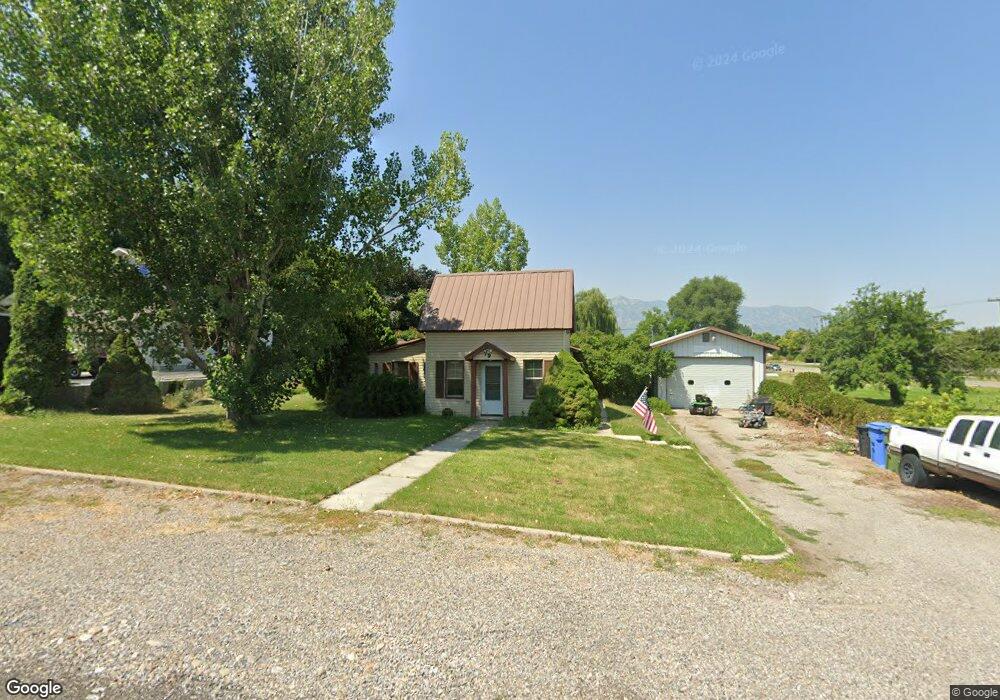
About This Home
This home is located at 79 N 100 E, Hyrum, UT 84319 and is currently estimated at $352,150, approximately $304 per square foot. 79 N 100 E is a home located in Cache County with nearby schools including Lincoln School, South Cache Middle School, and Mountain Crest High School.
Ownership History
Date
Name
Owned For
Owner Type
Purchase Details
Closed on
Jan 30, 2013
Sold by
Harrop Jason Scott and Harrop Luke Justin
Bought by
Harrop Ronald Scott and Ronald Scott Harrop Family Trust
Current Estimated Value
Home Financials for this Owner
Home Financials are based on the most recent Mortgage that was taken out on this home.
Original Mortgage
$207,000
Outstanding Balance
$197,518
Interest Rate
2.82%
Mortgage Type
Reverse Mortgage Home Equity Conversion Mortgage
Estimated Equity
$154,632
Purchase Details
Closed on
Sep 25, 2012
Sold by
Harrop Jason Scott
Bought by
Harrop Ronald Scott and Ronald Scott Harrop Family Trust
Purchase Details
Closed on
Aug 5, 2008
Sold by
Brown Arlene Harrop
Bought by
Weber Christopher A
Create a Home Valuation Report for This Property
The Home Valuation Report is an in-depth analysis detailing your home's value as well as a comparison with similar homes in the area
Home Values in the Area
Average Home Value in this Area
Purchase History
| Date | Buyer | Sale Price | Title Company |
|---|---|---|---|
| Harrop Ronald Scott | -- | None Available | |
| Harrop Ronald Scott | -- | None Available | |
| Weber Christopher A | -- | Hickman Land Title Company |
Source: Public Records
Mortgage History
| Date | Status | Borrower | Loan Amount |
|---|---|---|---|
| Open | Harrop Ronald Scott | $207,000 |
Source: Public Records
Tax History Compared to Growth
Tax History
| Year | Tax Paid | Tax Assessment Tax Assessment Total Assessment is a certain percentage of the fair market value that is determined by local assessors to be the total taxable value of land and additions on the property. | Land | Improvement |
|---|---|---|---|---|
| 2025 | $1,293 | $185,665 | $0 | $0 |
| 2023 | $1,217 | $156,050 | $0 | $0 |
| 2022 | $1,062 | $130,465 | $0 | $0 |
| 2021 | $10 | $189,862 | $71,490 | $118,372 |
| 2020 | $915 | $162,546 | $71,490 | $91,056 |
| 2019 | $850 | $141,926 | $50,870 | $91,056 |
| 2018 | $818 | $132,170 | $50,870 | $81,300 |
| 2017 | $786 | $65,875 | $0 | $0 |
| 2016 | $804 | $65,875 | $0 | $0 |
| 2015 | $806 | $65,875 | $0 | $0 |
| 2014 | $786 | $65,710 | $0 | $0 |
| 2013 | $725 | $65,710 | $0 | $0 |
Source: Public Records
Map
Nearby Homes