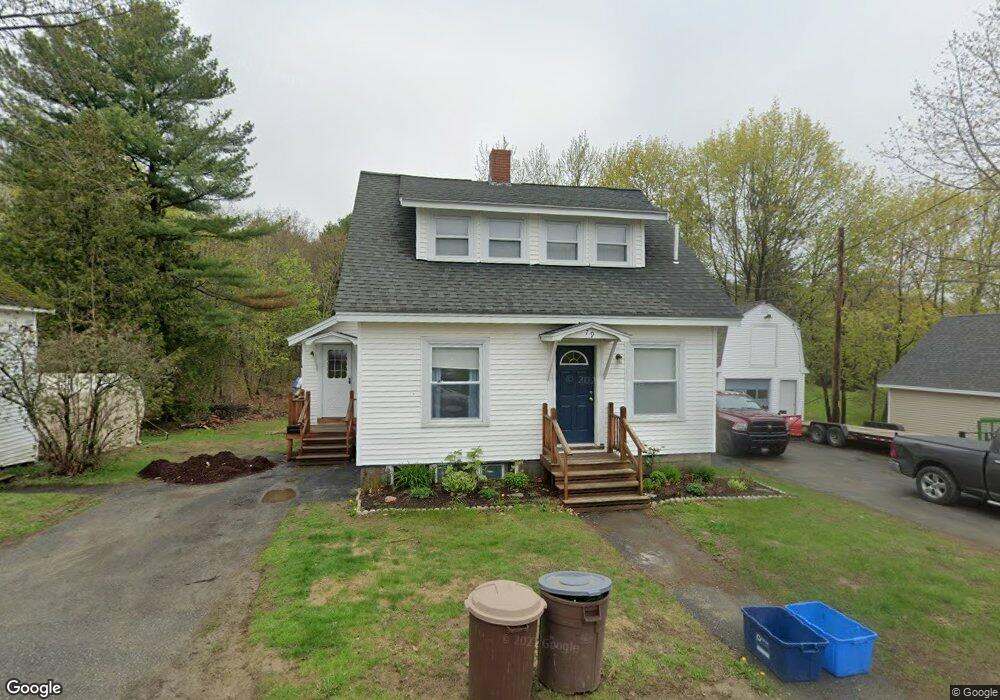
79 Olive St Bangor, ME 04401
West Bangor NeighborhoodEstimated Value: $253,000 - $338,000
2
Beds
4
Baths
1,674
Sq Ft
$183/Sq Ft
Est. Value
About This Home
This home is located at 79 Olive St, Bangor, ME 04401 and is currently estimated at $306,459, approximately $183 per square foot. 79 Olive St is a home located in Penobscot County with nearby schools including Vine Street School, Fairmount School, and James F. Doughty School.
Ownership History
Date
Name
Owned For
Owner Type
Purchase Details
Closed on
Feb 28, 2018
Sold by
Payne Jason E
Bought by
Payne Denise W
Current Estimated Value
Home Financials for this Owner
Home Financials are based on the most recent Mortgage that was taken out on this home.
Original Mortgage
$121,082
Outstanding Balance
$102,908
Interest Rate
4.04%
Mortgage Type
FHA
Estimated Equity
$203,551
Purchase Details
Closed on
Aug 2, 2006
Sold by
Jones C R Est
Bought by
Payne Jason E and Payne Denise W
Home Financials for this Owner
Home Financials are based on the most recent Mortgage that was taken out on this home.
Original Mortgage
$135,000
Interest Rate
6.7%
Mortgage Type
Purchase Money Mortgage
Create a Home Valuation Report for This Property
The Home Valuation Report is an in-depth analysis detailing your home's value as well as a comparison with similar homes in the area
Home Values in the Area
Average Home Value in this Area
Purchase History
| Date | Buyer | Sale Price | Title Company |
|---|---|---|---|
| Payne Denise W | -- | -- | |
| Payne Jason E | -- | -- |
Source: Public Records
Mortgage History
| Date | Status | Borrower | Loan Amount |
|---|---|---|---|
| Open | Payne Denise W | $121,082 | |
| Closed | Payne Jason E | $135,000 |
Source: Public Records
Tax History Compared to Growth
Tax History
| Year | Tax Paid | Tax Assessment Tax Assessment Total Assessment is a certain percentage of the fair market value that is determined by local assessors to be the total taxable value of land and additions on the property. | Land | Improvement |
|---|---|---|---|---|
| 2024 | $4,283 | $230,900 | $44,600 | $186,300 |
| 2023 | $4,079 | $213,000 | $44,600 | $168,400 |
| 2022 | $3,584 | $175,700 | $42,000 | $133,700 |
| 2021 | $3,506 | $157,200 | $38,900 | $118,300 |
| 2020 | $3,029 | $146,000 | $37,000 | $109,000 |
| 2019 | $3,250 | $141,300 | $37,000 | $104,300 |
| 2018 | $3,135 | $136,600 | $37,000 | $99,600 |
| 2017 | $2,483 | $111,300 | $23,300 | $88,000 |
| 2016 | $2,457 | $109,200 | $23,300 | $85,900 |
| 2015 | $2,417 | $110,100 | $23,300 | $86,800 |
| 2014 | $2,370 | $108,700 | $23,300 | $85,400 |
| 2013 | $2,278 | $109,500 | $23,300 | $86,200 |
Source: Public Records
Map
Nearby Homes
- 65 Olive St
- 80 Olive St
- 89 Olive St
- 86 Olive St
- 9 Olive Heights
- 54 Olive St
- 92 Olive St
- 11 Olive Heights
- 12 Olive Heights
- 14 Olive Heights
- 18 Olive Heights
- 751 Main St
- 78 Crosby St
- 735 Main St
- 840 S Main
- 812 Main Rd N
- 15 Woodland Rd
- 9999 Old County Road Discontinued
- 999 Old County Road Discontinued
- 442 Route 2 St