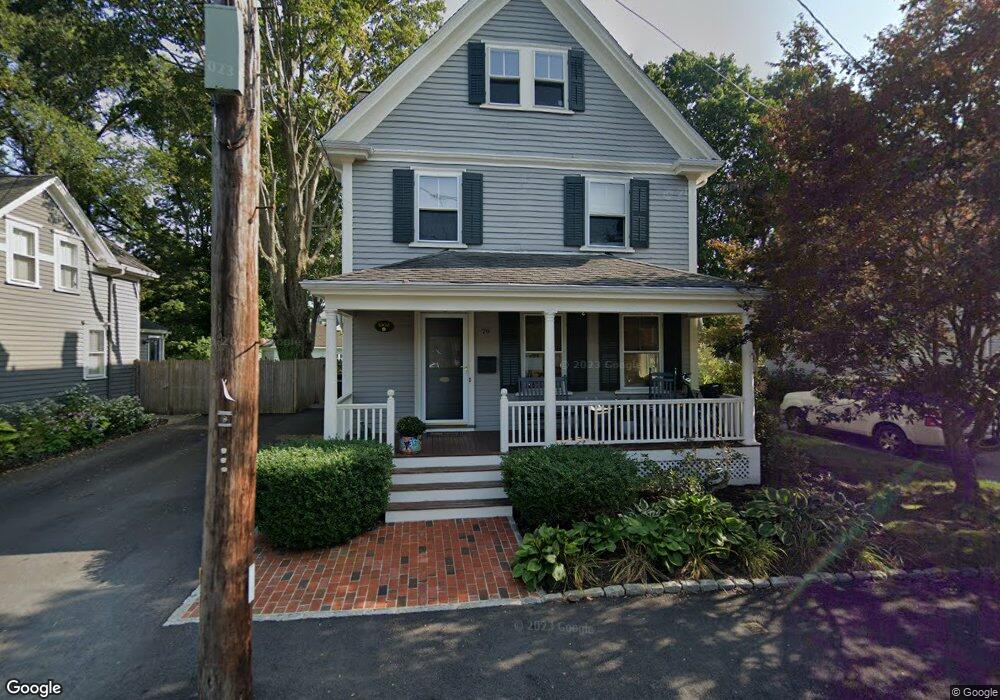
79 Richards St Dedham, MA 02026
Dedham Village NeighborhoodEstimated Value: $933,060 - $1,124,000
4
Beds
3
Baths
2,029
Sq Ft
$499/Sq Ft
Est. Value
About This Home
This home is located at 79 Richards St, Dedham, MA 02026 and is currently estimated at $1,012,015, approximately $498 per square foot. 79 Richards St is a home located in Norfolk County with nearby schools including Riverdale Elementary School, Dedham Middle School, and Dedham High School.
Ownership History
Date
Name
Owned For
Owner Type
Purchase Details
Closed on
Feb 22, 2016
Sold by
Formisano James A and Formisano Kimberly D
Bought by
James A Formisano Ft and Formisano James A
Current Estimated Value
Purchase Details
Closed on
Jan 7, 2004
Sold by
Share Donald S and Pope Jacquelyn J
Bought by
Formisano James A and Formisano Kimberly D
Purchase Details
Closed on
Feb 12, 1999
Sold by
Civian Frederick T and Civian Janet T
Bought by
Share Donald S
Purchase Details
Closed on
Sep 27, 1990
Sold by
Morse Donald E
Bought by
Civian Frederick T
Create a Home Valuation Report for This Property
The Home Valuation Report is an in-depth analysis detailing your home's value as well as a comparison with similar homes in the area
Home Values in the Area
Average Home Value in this Area
Purchase History
| Date | Buyer | Sale Price | Title Company |
|---|---|---|---|
| James A Formisano Ft | -- | -- | |
| Formisano James A | $452,000 | -- | |
| Share Donald S | $270,000 | -- | |
| Civian Frederick T | $185,000 | -- |
Source: Public Records
Mortgage History
| Date | Status | Borrower | Loan Amount |
|---|---|---|---|
| Previous Owner | Civian Frederick T | $400,000 |
Source: Public Records
Tax History
| Year | Tax Paid | Tax Assessment Tax Assessment Total Assessment is a certain percentage of the fair market value that is determined by local assessors to be the total taxable value of land and additions on the property. | Land | Improvement |
|---|---|---|---|---|
| 2025 | $10,774 | $853,700 | $334,900 | $518,800 |
| 2024 | $10,338 | $827,000 | $321,800 | $505,200 |
| 2023 | $8,925 | $695,100 | $282,400 | $412,700 |
| 2022 | $8,248 | $617,800 | $258,300 | $359,500 |
| 2021 | $7,782 | $569,300 | $262,700 | $306,600 |
| 2020 | $7,619 | $555,300 | $251,300 | $304,000 |
| 2019 | $7,654 | $540,900 | $243,700 | $297,200 |
| 2018 | $7,726 | $531,000 | $224,700 | $306,300 |
| 2017 | $7,255 | $491,500 | $198,800 | $292,700 |
| 2016 | $7,527 | $485,900 | $179,600 | $306,300 |
| 2015 | $7,253 | $457,000 | $190,600 | $266,400 |
| 2014 | $7,109 | $442,100 | $190,600 | $251,500 |
Source: Public Records
Map
Nearby Homes
- 165 Highland St Unit 165
- 44 Court St
- 441 Washington St Unit 301
- 55 Church St Unit 1
- 46 Church St
- 92 Old River Place
- 37 Horrigan Dr Unit 1
- 57 Horrigan Dr Unit 3
- 66 Horrigan Dr Unit 25
- 107 Horrigan Dr Unit 12
- 80 Horrigan Dr Unit 24
- 86 Horrigan Dr Unit 23
- 87 Horrigan Dr Unit 8
- 58 Jersey St
- 442 High St
- 213 Sandy Valley Rd
- 42 Churchill Place
- 28 Linden Place
- 600 East St
- 56 Mount Vernon St
- 83 Richards St
- 69 Richards St
- 59 Richards St
- 87 Richards St
- 84 Richards St
- 53 Richards St
- 76 Richards St Unit 2
- 76 Richards St
- 86 Richards St
- 93 Richards St
- 66 Richards St
- 62 Richards St
- 90 Richards St
- 49 Richards St
- 74 Richards St
- 70 Richards St
- 97 Richards St
- 82 Highland St
- 72 Richards St
- 104 Richards St
Your Personal Tour Guide
Ask me questions while you tour the home.