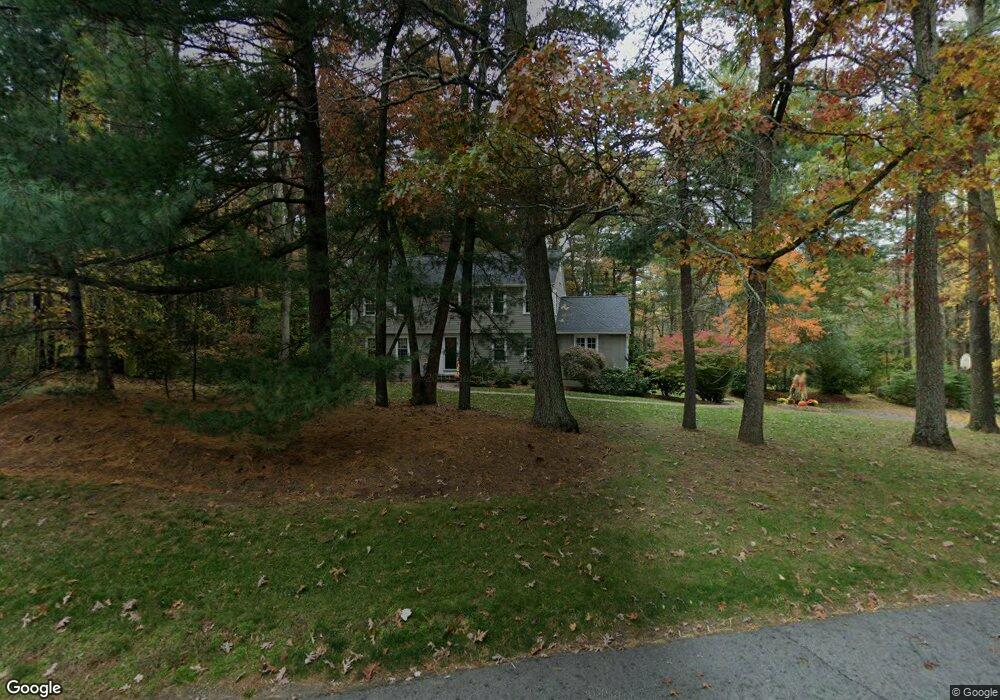
79 Robert Best Rd Sudbury, MA 01776
Estimated Value: $1,019,000 - $1,226,000
4
Beds
3
Baths
2,448
Sq Ft
$455/Sq Ft
Est. Value
About This Home
This home is located at 79 Robert Best Rd, Sudbury, MA 01776 and is currently estimated at $1,113,228, approximately $454 per square foot. 79 Robert Best Rd is a home located in Middlesex County with nearby schools including Israel Loring Elementary School, Ephraim Curtis Middle School, and Lincoln-Sudbury Regional High School.
Ownership History
Date
Name
Owned For
Owner Type
Purchase Details
Closed on
Jun 5, 2019
Sold by
Billig Richard L and Billig Martha T
Bought by
Billig Ft
Current Estimated Value
Purchase Details
Closed on
Dec 30, 1999
Sold by
Curley Joseph and Curley Marilyn J
Bought by
Billig Richard L and Billig Martha T
Purchase Details
Closed on
Nov 13, 1990
Sold by
Mckay Dennis L
Bought by
Curley Joseph
Create a Home Valuation Report for This Property
The Home Valuation Report is an in-depth analysis detailing your home's value as well as a comparison with similar homes in the area
Home Values in the Area
Average Home Value in this Area
Purchase History
| Date | Buyer | Sale Price | Title Company |
|---|---|---|---|
| Billig Ft | -- | -- | |
| Billig Richard L | $446,000 | -- | |
| Curley Joseph | $319,000 | -- |
Source: Public Records
Mortgage History
| Date | Status | Borrower | Loan Amount |
|---|---|---|---|
| Previous Owner | Curley Joseph | $330,000 | |
| Previous Owner | Curley Joseph | $344,000 |
Source: Public Records
Tax History Compared to Growth
Tax History
| Year | Tax Paid | Tax Assessment Tax Assessment Total Assessment is a certain percentage of the fair market value that is determined by local assessors to be the total taxable value of land and additions on the property. | Land | Improvement |
|---|---|---|---|---|
| 2025 | $14,362 | $981,000 | $450,100 | $530,900 |
| 2024 | $14,543 | $995,400 | $437,400 | $558,000 |
| 2023 | $13,537 | $858,400 | $391,700 | $466,700 |
| 2022 | $13,213 | $732,000 | $360,000 | $372,000 |
| 2021 | $12,633 | $670,900 | $360,000 | $310,900 |
| 2020 | $12,378 | $670,900 | $360,000 | $310,900 |
| 2019 | $12,016 | $670,900 | $360,000 | $310,900 |
| 2018 | $11,936 | $665,700 | $382,500 | $283,200 |
| 2017 | $12,599 | $710,200 | $429,800 | $280,400 |
| 2016 | $12,209 | $685,900 | $413,800 | $272,100 |
| 2015 | $11,426 | $649,200 | $382,600 | $266,600 |
| 2014 | $11,404 | $632,500 | $371,500 | $261,000 |
Source: Public Records
Map
Nearby Homes
- 143 Peakham Rd
- 7 Saddle Ridge Rd
- 30 Rolling Ln
- 12 Hickory Rd
- 54 Stone Rd
- 0 Robbins Rd
- 21 Summer St
- 0 Boston Post Rd
- 89 Bridle Path
- 7 Adams Rd
- 123 Dutton Rd
- 24 Woodland Rd
- 270 Old Lancaster Rd
- 1011 Boston Post Rd
- 128 Nobscot Rd
- 36 Old Forge Ln
- 47 Fairbank Rd
- 24 Goodnow Rd
- 4 Elderberry Cir
- 30 Nobscot Rd Unit 14
- 71 Robert Best Rd
- 76 Robert Best Rd
- 115 Austin Rd
- 123 Austin Rd
- 91 Robert Best Rd
- 109 Austin Rd
- 98 Robert Best Rd
- 98 Robert Best Rd Unit 1
- 229 Peakham Rd
- 64 Robert Best Rd
- 101 Austin Rd
- 6 Colburn Cir
- 237 Peakham Rd
- 201 Peakham Rd
- 116 Austin Rd
- 122 Austin Rd
- 12 Colburn Cir
- 108 Austin Rd
- 193 Peakham Rd
- 95 Austin Rd