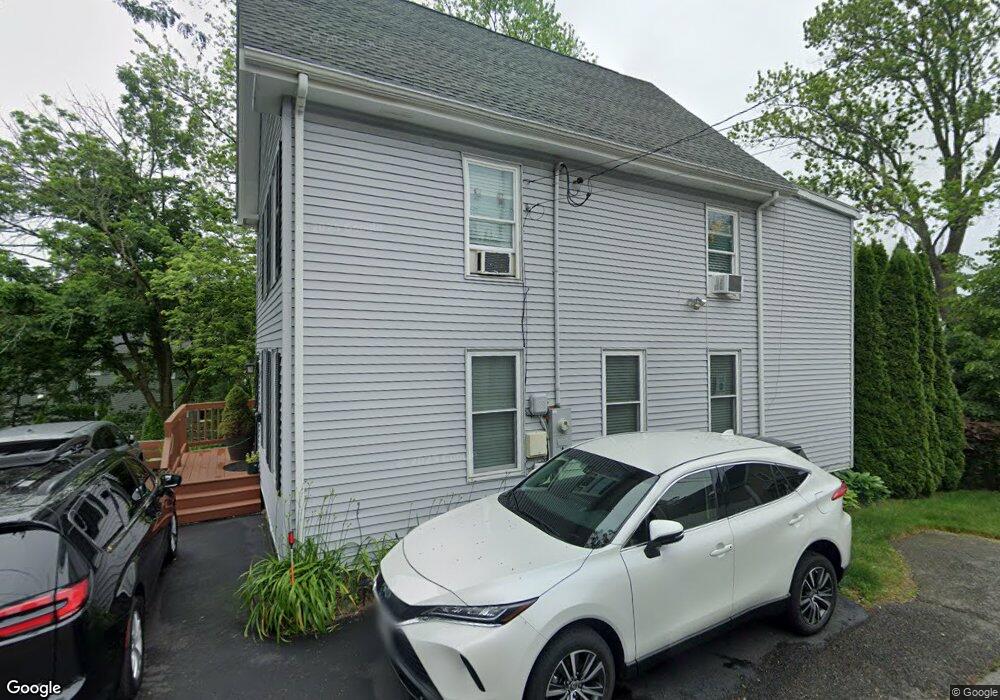
79 Roy St Swampscott, MA 01907
Estimated Value: $796,000 - $843,893
4
Beds
3
Baths
2,200
Sq Ft
$373/Sq Ft
Est. Value
About This Home
This home is located at 79 Roy St, Swampscott, MA 01907 and is currently estimated at $819,973, approximately $372 per square foot. 79 Roy St is a home located in Essex County with nearby schools including Swampscott Middle School and Swampscott High School.
Ownership History
Date
Name
Owned For
Owner Type
Purchase Details
Closed on
Jun 27, 2013
Sold by
Navarrete Alfred C and Navarrete Liza T
Bought by
Navarrete Arthur C
Current Estimated Value
Purchase Details
Closed on
Aug 27, 2004
Sold by
Brosnan Mary B and Brosnan Timothy P
Bought by
Navarrete Alfred C
Home Financials for this Owner
Home Financials are based on the most recent Mortgage that was taken out on this home.
Original Mortgage
$332,000
Interest Rate
6.02%
Mortgage Type
Purchase Money Mortgage
Create a Home Valuation Report for This Property
The Home Valuation Report is an in-depth analysis detailing your home's value as well as a comparison with similar homes in the area
Home Values in the Area
Average Home Value in this Area
Purchase History
| Date | Buyer | Sale Price | Title Company |
|---|---|---|---|
| Navarrete Arthur C | -- | -- | |
| Navarrete Arthur C | -- | -- | |
| Navarrete Alfred C | $415,000 | -- | |
| Navarrete Alfred C | $415,000 | -- |
Source: Public Records
Mortgage History
| Date | Status | Borrower | Loan Amount |
|---|---|---|---|
| Previous Owner | Navarrete Alfred C | $386,400 | |
| Previous Owner | Navarrete Alfred C | $72,500 | |
| Previous Owner | Navarrete Alfred C | $332,000 |
Source: Public Records
Tax History Compared to Growth
Tax History
| Year | Tax Paid | Tax Assessment Tax Assessment Total Assessment is a certain percentage of the fair market value that is determined by local assessors to be the total taxable value of land and additions on the property. | Land | Improvement |
|---|---|---|---|---|
| 2025 | $8,200 | $714,900 | $314,900 | $400,000 |
| 2024 | $7,974 | $694,000 | $299,900 | $394,100 |
| 2023 | $7,605 | $647,800 | $277,700 | $370,100 |
| 2022 | $7,389 | $575,900 | $244,300 | $331,600 |
| 2021 | $6,984 | $506,100 | $188,800 | $317,300 |
| 2020 | $7,010 | $490,200 | $177,700 | $312,500 |
| 2019 | $7,114 | $468,000 | $155,500 | $312,500 |
| 2018 | $7,106 | $444,100 | $155,500 | $288,600 |
| 2017 | $7,045 | $403,700 | $133,300 | $270,400 |
| 2016 | $6,514 | $375,900 | $105,500 | $270,400 |
| 2015 | $6,447 | $375,900 | $105,500 | $270,400 |
| 2014 | $6,201 | $331,600 | $75,500 | $256,100 |
Source: Public Records
Map
Nearby Homes
- 44 Cherry St Unit 2
- 100 Burpee Rd
- 59 Essex St Unit 59B
- 29-31 Essex Ave Unit 2
- 80 Norfolk Ave Unit 1
- 106 Norfolk Ave
- 189 Burrill St Unit 2
- 35 Columbia Ave
- 25 E Park Ave
- 76 Stetson Ave
- 133 Eastern Ave Unit 8
- 150 Windsor Ave
- 9 Sampson Ave
- 44 Valley Rd
- 31 Madison St
- 26 Groveland St
- 30 Clifton Ave
- 30 Paradise Rd
- 98 Paradise Rd
- 175 Essex St