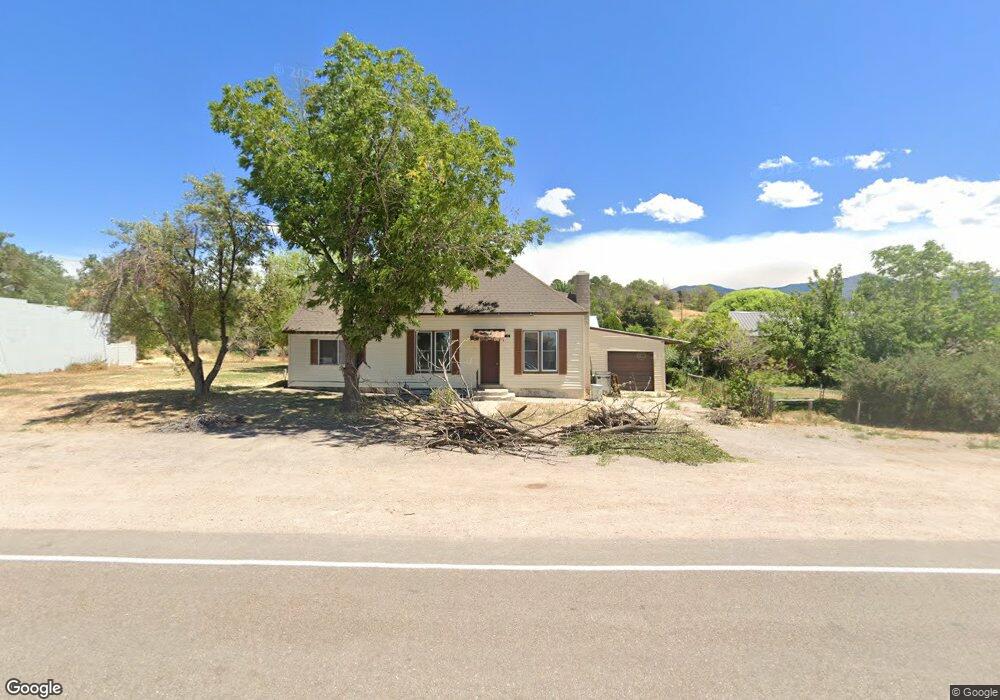
79 S Main St Fillmore, UT 84631
Estimated Value: $278,870 - $285,000
4
Beds
2
Baths
1,881
Sq Ft
$150/Sq Ft
Est. Value
About This Home
This home is located at 79 S Main St, Fillmore, UT 84631 and is currently estimated at $281,935, approximately $149 per square foot. 79 S Main St is a home located in Millard County.
Ownership History
Date
Name
Owned For
Owner Type
Purchase Details
Closed on
Jan 28, 2025
Sold by
Visser Pamela
Bought by
Pav Properties Llc
Current Estimated Value
Purchase Details
Closed on
Feb 22, 2017
Sold by
Wells Fargo Bank
Bought by
Visser Otto and Visser Pamela
Purchase Details
Closed on
May 20, 2016
Sold by
Cit Bank Na
Bought by
Wells Fargo Bank
Purchase Details
Closed on
Apr 15, 2016
Sold by
Etitle Insurance Agency
Bought by
Cit Bank Na
Purchase Details
Closed on
Nov 13, 2007
Sold by
Talbot Arthur Jay and Talbot Debra
Bought by
Talbot Arthur J and Talbot Darlene M
Home Financials for this Owner
Home Financials are based on the most recent Mortgage that was taken out on this home.
Original Mortgage
$153,000
Interest Rate
6.21%
Mortgage Type
Reverse Mortgage Home Equity Conversion Mortgage
Create a Home Valuation Report for This Property
The Home Valuation Report is an in-depth analysis detailing your home's value as well as a comparison with similar homes in the area
Purchase History
| Date | Buyer | Sale Price | Title Company |
|---|---|---|---|
| Pav Properties Llc | -- | None Listed On Document | |
| Visser Otto | $67,000 | -- | |
| Wells Fargo Bank | -- | -- | |
| Cit Bank Na | -- | First American Title | |
| Talbot Arthur J | -- | -- |
Source: Public Records
Mortgage History
| Date | Status | Borrower | Loan Amount |
|---|---|---|---|
| Previous Owner | Talbot Arthur J | $153,000 |
Source: Public Records
Tax History
| Year | Tax Paid | Tax Assessment Tax Assessment Total Assessment is a certain percentage of the fair market value that is determined by local assessors to be the total taxable value of land and additions on the property. | Land | Improvement |
|---|---|---|---|---|
| 2025 | $933 | $120,169 | $14,458 | $105,711 |
| 2024 | $933 | $113,282 | $11,523 | $101,759 |
| 2023 | $1,188 | $113,282 | $11,523 | $101,759 |
| 2022 | $988 | $91,493 | $9,602 | $81,891 |
| 2021 | $783 | $69,251 | $8,001 | $61,250 |
| 2020 | $662 | $58,837 | $6,958 | $51,879 |
| 2019 | $651 | $58,204 | $6,325 | $51,879 |
| 2018 | $596 | $54,408 | $5,500 | $48,908 |
| 2017 | $584 | $50,843 | $5,500 | $45,343 |
| 2016 | $470 | $42,526 | $5,500 | $37,026 |
| 2015 | $470 | $42,526 | $5,500 | $37,026 |
| 2014 | -- | $42,526 | $5,500 | $37,026 |
| 2013 | -- | $42,526 | $5,500 | $37,026 |
Source: Public Records
Map
Nearby Homes
- 164 W 200 North Rd
- 600 E 1200 St N
- 3700 W 5800 N
- 205 N 100 E
- 2155 N Cedar Mountain Rd
- 2835 N Cedar Mountain Rd
- 390 N 100 W
- 335 W 400 North St
- 410 W 400 N
- 245 W 300 N
- 225 W 200 St N
- 400 W 2600 North St
- 75 N 100 West St
- 40 S 100 Rd E
- 155 W Center St
- 430 E Canyon Rd
- 235 S 200 St E
- 220 S 200 E
- 351 W 100 South St
- 260 W 200 S
Your Personal Tour Guide
Ask me questions while you tour the home.