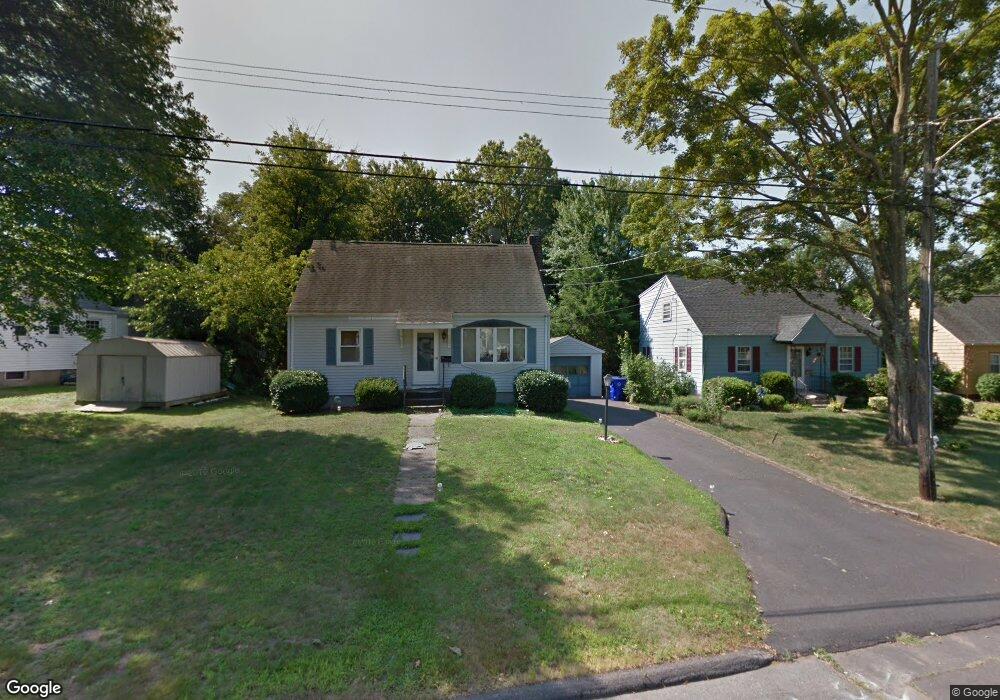
79 Salem Rd East Hartford, CT 06118
Estimated Value: $267,000 - $304,000
3
Beds
1
Bath
1,116
Sq Ft
$258/Sq Ft
Est. Value
About This Home
This home is located at 79 Salem Rd, East Hartford, CT 06118 and is currently estimated at $287,779, approximately $257 per square foot. 79 Salem Rd is a home located in Hartford County with nearby schools including Joseph O. Goodwin School, East Hartford Middle School, and East Hartford High School.
Ownership History
Date
Name
Owned For
Owner Type
Purchase Details
Closed on
Feb 3, 2003
Sold by
Ott Wesley R and Ott Heather L
Bought by
Lewis Calvin R and Lewis Sharronne J
Current Estimated Value
Home Financials for this Owner
Home Financials are based on the most recent Mortgage that was taken out on this home.
Original Mortgage
$152,148
Interest Rate
6.09%
Purchase Details
Closed on
May 30, 2002
Sold by
Ingersoll Peter J and Ingersoll Leah J
Bought by
Ott Wesle R and Ott Heather D
Purchase Details
Closed on
Feb 23, 1990
Sold by
Perrault Charles E
Bought by
Ingersoll Peter J
Create a Home Valuation Report for This Property
The Home Valuation Report is an in-depth analysis detailing your home's value as well as a comparison with similar homes in the area
Home Values in the Area
Average Home Value in this Area
Purchase History
| Date | Buyer | Sale Price | Title Company |
|---|---|---|---|
| Lewis Calvin R | $149,900 | -- | |
| Ott Wesle R | $135,000 | -- | |
| Ingersoll Peter J | $128,000 | -- |
Source: Public Records
Mortgage History
| Date | Status | Borrower | Loan Amount |
|---|---|---|---|
| Open | Ingersoll Peter J | $154,246 | |
| Closed | Ingersoll Peter J | $35,000 | |
| Closed | Ingersoll Peter J | $152,148 |
Source: Public Records
Tax History Compared to Growth
Tax History
| Year | Tax Paid | Tax Assessment Tax Assessment Total Assessment is a certain percentage of the fair market value that is determined by local assessors to be the total taxable value of land and additions on the property. | Land | Improvement |
|---|---|---|---|---|
| 2025 | $5,704 | $124,270 | $37,310 | $86,960 |
| 2024 | $5,468 | $124,270 | $37,310 | $86,960 |
| 2023 | $5,286 | $124,270 | $37,310 | $86,960 |
| 2022 | $5,095 | $124,270 | $37,310 | $86,960 |
| 2021 | $4,394 | $89,040 | $28,270 | $60,770 |
| 2020 | $4,445 | $89,040 | $28,270 | $60,770 |
| 2019 | $4,373 | $89,040 | $28,270 | $60,770 |
| 2018 | $4,244 | $89,040 | $28,270 | $60,770 |
| 2017 | $4,189 | $89,040 | $28,270 | $60,770 |
| 2016 | $4,173 | $90,990 | $28,270 | $62,720 |
| 2015 | $4,173 | $90,990 | $28,270 | $62,720 |
| 2014 | $4,131 | $90,990 | $28,270 | $62,720 |
Source: Public Records
Map
Nearby Homes