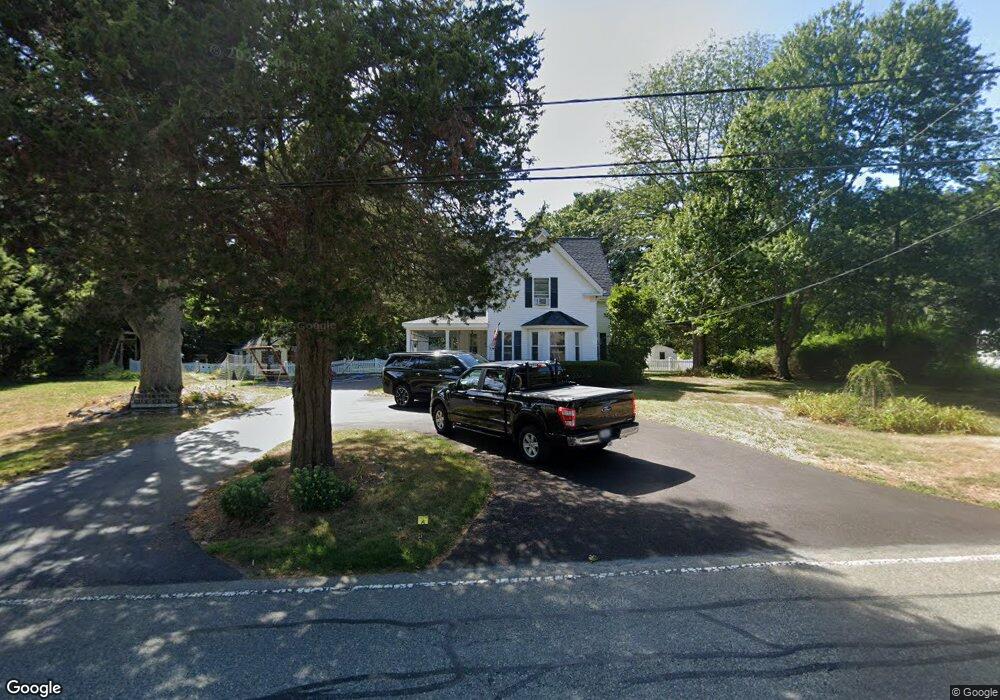
79 Spring St Hanover, MA 02339
Estimated Value: $707,550 - $814,000
4
Beds
2
Baths
1,692
Sq Ft
$438/Sq Ft
Est. Value
About This Home
This home is located at 79 Spring St, Hanover, MA 02339 and is currently estimated at $741,888, approximately $438 per square foot. 79 Spring St is a home located in Plymouth County with nearby schools including Hanover High School, Cadence Academy Preschool - Hanover, and The Master's Academy.
Ownership History
Date
Name
Owned For
Owner Type
Purchase Details
Closed on
Nov 26, 2024
Sold by
Sprague Jacob T and Sprague Haley L
Bought by
79 Spring St Rt and Sprague
Current Estimated Value
Purchase Details
Closed on
Jun 20, 2014
Sold by
Falla William S and Falla Dayna M
Bought by
Sprague Haley L and Sprague Jacob T
Home Financials for this Owner
Home Financials are based on the most recent Mortgage that was taken out on this home.
Original Mortgage
$324,000
Interest Rate
4.21%
Mortgage Type
New Conventional
Purchase Details
Closed on
Oct 28, 2004
Sold by
Kenneally Brian J and Kenneally Diana J
Bought by
Falla William S and Falla Dayna M
Purchase Details
Closed on
Sep 15, 2000
Sold by
Gorrill Nancy M and Gorrill Charles A
Bought by
Kenneally Diana J and Kenneally Brian J
Purchase Details
Closed on
Nov 26, 1996
Sold by
Gorrill Lorne H and Gorrill Phyllis A
Bought by
Gorrill Charles A and Gorrill Nancy
Create a Home Valuation Report for This Property
The Home Valuation Report is an in-depth analysis detailing your home's value as well as a comparison with similar homes in the area
Home Values in the Area
Average Home Value in this Area
Purchase History
| Date | Buyer | Sale Price | Title Company |
|---|---|---|---|
| 79 Spring St Rt | -- | None Available | |
| 79 Spring St Rt | -- | None Available | |
| Sprague Haley L | $405,000 | -- | |
| Falla William S | $369,000 | -- | |
| Kenneally Diana J | $250,000 | -- | |
| Gorrill Charles A | $150,000 | -- | |
| Falla William S | $369,000 | -- | |
| Kenneally Diana J | $250,000 | -- | |
| Gorrill Charles A | $150,000 | -- |
Source: Public Records
Mortgage History
| Date | Status | Borrower | Loan Amount |
|---|---|---|---|
| Previous Owner | Sprague Haley L | $324,000 | |
| Previous Owner | Gorrill Charles A | $45,000 |
Source: Public Records
Tax History
| Year | Tax Paid | Tax Assessment Tax Assessment Total Assessment is a certain percentage of the fair market value that is determined by local assessors to be the total taxable value of land and additions on the property. | Land | Improvement |
|---|---|---|---|---|
| 2025 | $7,889 | $638,800 | $284,100 | $354,700 |
| 2024 | $7,672 | $597,500 | $284,100 | $313,400 |
| 2023 | $7,569 | $561,100 | $258,800 | $302,300 |
| 2022 | $7,738 | $507,400 | $258,800 | $248,600 |
| 2021 | $280 | $482,700 | $235,700 | $247,000 |
| 2020 | $7,811 | $478,900 | $235,700 | $243,200 |
| 2019 | $7,419 | $452,100 | $235,700 | $216,400 |
| 2018 | $7,137 | $438,400 | $235,700 | $202,700 |
| 2017 | $379 | $385,700 | $219,400 | $166,300 |
| 2016 | $6,058 | $359,300 | $199,800 | $159,500 |
| 2015 | $5,475 | $339,000 | $199,800 | $139,200 |
Source: Public Records
Map
Nearby Homes
- 250 Center St
- 33 1st Parish Ln
- 51 Cervelli Farm Dr
- 37 Dr
- 23 Cervelli Farm Dr
- 38 Cervelli Farm Dr
- 9 Cervelli Farm Dr
- 35 Sproul Rd
- 36 Grove St
- 70 Bardin St
- 114 Graham Hill Dr
- 365 Broadway
- 62 Larchmont Ln
- 68 East St
- 506 Main St
- 51 Farmside Dr
- 95 Tecumseh Dr
- 60 Summer Path Way
- 7 Farmside Dr
- 285 W Elm St
Your Personal Tour Guide
Ask me questions while you tour the home.