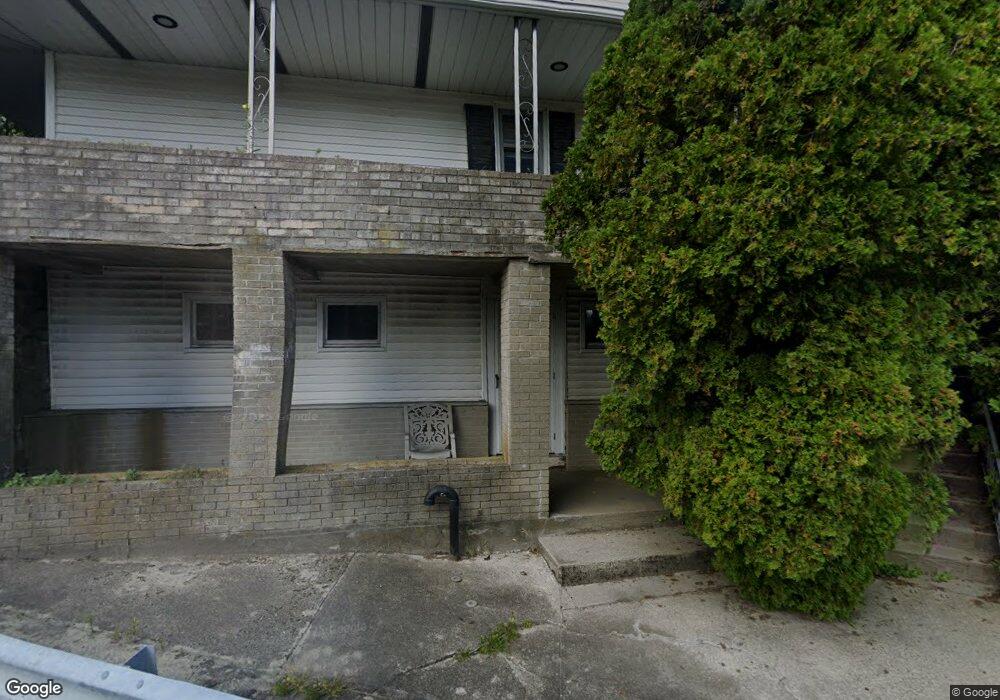
79 Stillman Ave Pawcatuck, CT 06379
Estimated Value: $378,000 - $652,000
5
Beds
2
Baths
2,471
Sq Ft
$216/Sq Ft
Est. Value
About This Home
This home is located at 79 Stillman Ave, Pawcatuck, CT 06379 and is currently estimated at $533,613, approximately $215 per square foot. 79 Stillman Ave is a home located in New London County with nearby schools including Stonington Middle School, Stonington High School, and North Stonington Christian Academy.
Ownership History
Date
Name
Owned For
Owner Type
Purchase Details
Closed on
Jul 17, 2025
Sold by
Klepach George T
Bought by
George T Klepach Lt and Klepach
Current Estimated Value
Purchase Details
Closed on
Apr 19, 2024
Sold by
Klepach George and Klepach Linda
Bought by
Klepach George T
Purchase Details
Closed on
Mar 26, 1987
Sold by
Ferraro Armand T
Bought by
Klepach George
Create a Home Valuation Report for This Property
The Home Valuation Report is an in-depth analysis detailing your home's value as well as a comparison with similar homes in the area
Home Values in the Area
Average Home Value in this Area
Purchase History
| Date | Buyer | Sale Price | Title Company |
|---|---|---|---|
| George T Klepach Lt | -- | -- | |
| Klepach George T | -- | None Available | |
| Klepach George T | -- | None Available | |
| Klepach George | $125,999 | -- |
Source: Public Records
Mortgage History
| Date | Status | Borrower | Loan Amount |
|---|---|---|---|
| Previous Owner | Klepach George | $132,000 | |
| Previous Owner | Klepach George | $135,000 | |
| Previous Owner | Klepach George | $47,000 | |
| Previous Owner | Klepach George | $220,000 |
Source: Public Records
Tax History Compared to Growth
Tax History
| Year | Tax Paid | Tax Assessment Tax Assessment Total Assessment is a certain percentage of the fair market value that is determined by local assessors to be the total taxable value of land and additions on the property. | Land | Improvement |
|---|---|---|---|---|
| 2025 | $4,052 | $203,800 | $47,600 | $156,200 |
| 2024 | $3,882 | $203,800 | $47,600 | $156,200 |
| 2023 | $3,883 | $203,800 | $47,600 | $156,200 |
| 2022 | $4,320 | $168,700 | $44,200 | $124,500 |
| 2021 | $1,944 | $168,700 | $44,200 | $124,500 |
| 2020 | $1,944 | $168,700 | $44,200 | $124,500 |
| 2019 | $1,944 | $168,700 | $44,200 | $124,500 |
| 2018 | $4,093 | $168,700 | $44,200 | $124,500 |
| 2017 | $3,543 | $143,900 | $39,300 | $104,600 |
| 2016 | $3,446 | $143,900 | $39,300 | $104,600 |
| 2015 | $3,235 | $143,900 | $39,300 | $104,600 |
| 2014 | $3,164 | $143,900 | $39,300 | $104,600 |
Source: Public Records
Map
Nearby Homes