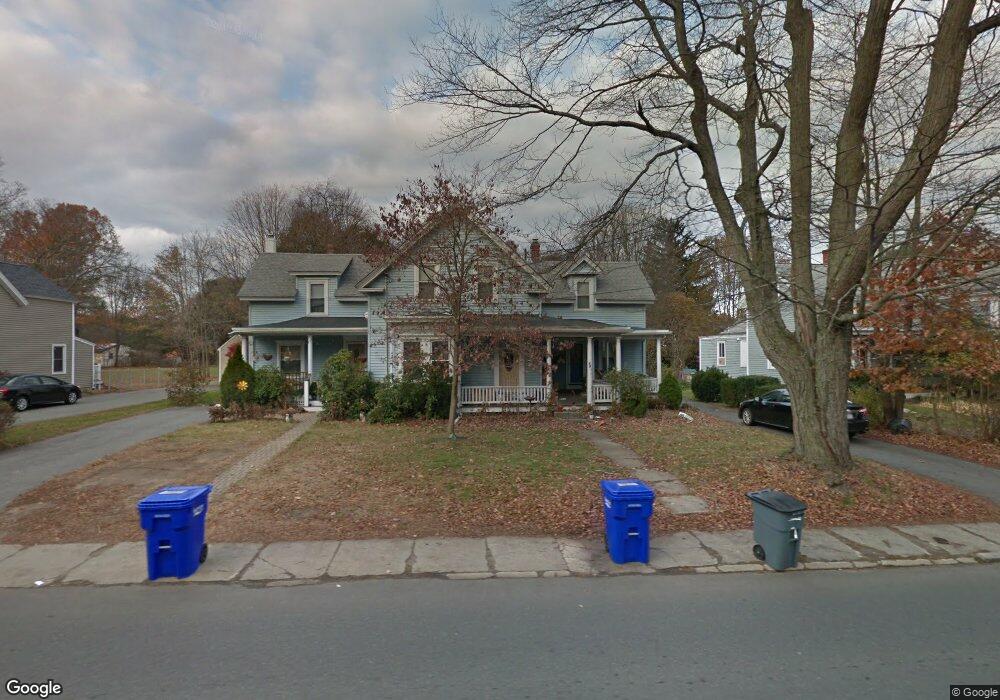
79 Summer St Unit 81 Maynard, MA 01754
Estimated Value: $679,000 - $840,675
7
Beds
4
Baths
3,789
Sq Ft
$204/Sq Ft
Est. Value
About This Home
This home is located at 79 Summer St Unit 81, Maynard, MA 01754 and is currently estimated at $774,169, approximately $204 per square foot. 79 Summer St Unit 81 is a home located in Middlesex County with nearby schools including Green Meadow School, Fowler School, and Maynard High School.
Ownership History
Date
Name
Owned For
Owner Type
Purchase Details
Closed on
Oct 23, 2009
Sold by
Gaudet Leo R and Gaudet Irene M
Bought by
Mellish Roberta A and Kumpey Patricia
Current Estimated Value
Home Financials for this Owner
Home Financials are based on the most recent Mortgage that was taken out on this home.
Original Mortgage
$409,543
Interest Rate
5.09%
Mortgage Type
Purchase Money Mortgage
Purchase Details
Closed on
Apr 4, 2000
Sold by
Morgan Carole A and Morgan Steven W
Bought by
Gaudet Leo R and Gaudet Irene M
Create a Home Valuation Report for This Property
The Home Valuation Report is an in-depth analysis detailing your home's value as well as a comparison with similar homes in the area
Home Values in the Area
Average Home Value in this Area
Purchase History
| Date | Buyer | Sale Price | Title Company |
|---|---|---|---|
| Mellish Roberta A | $451,500 | -- | |
| Gaudet Leo R | $308,000 | -- |
Source: Public Records
Mortgage History
| Date | Status | Borrower | Loan Amount |
|---|---|---|---|
| Open | Gaudet Leo R | $410,833 | |
| Closed | Mellish Roberta A | $409,543 | |
| Previous Owner | Gaudet Leo R | $65,000 | |
| Previous Owner | Gaudet Leo R | $111,000 |
Source: Public Records
Tax History Compared to Growth
Tax History
| Year | Tax Paid | Tax Assessment Tax Assessment Total Assessment is a certain percentage of the fair market value that is determined by local assessors to be the total taxable value of land and additions on the property. | Land | Improvement |
|---|---|---|---|---|
| 2025 | $11,361 | $637,200 | $297,400 | $339,800 |
| 2024 | $11,145 | $623,300 | $283,200 | $340,100 |
| 2023 | $11,162 | $588,400 | $269,800 | $318,600 |
| 2022 | $11,188 | $545,200 | $226,600 | $318,600 |
| 2021 | $10,675 | $529,800 | $226,600 | $303,200 |
| 2020 | $10,498 | $508,600 | $205,000 | $303,600 |
| 2019 | $9,537 | $453,300 | $195,800 | $257,500 |
| 2018 | $8,995 | $397,300 | $178,000 | $219,300 |
| 2017 | $8,745 | $397,300 | $178,000 | $219,300 |
| 2016 | $8,443 | $397,300 | $178,000 | $219,300 |
| 2015 | $8,928 | $400,200 | $169,900 | $230,300 |
| 2014 | $9,143 | $410,200 | $164,500 | $245,700 |
Source: Public Records
Map
Nearby Homes
- 25-27 Brooks St
- 91 Nason St
- 47 Summer Hill Rd
- 49 Summer Hill Rd
- 30 Acton St
- 12 Walcott St
- 2 Wall Ct
- 17 Prospect St
- 37 Glendale St
- 30-32 Walnut St
- 10 Mill St Unit B
- 20 Tremont St
- 7 King St
- 162 Summer St
- 22-26 Waltham St
- 28 Waltham St Unit A
- 28 Waltham St Unit B
- 6 Durant Ave
- 22 Garfield Ave
- 13 Arthur St Unit 15