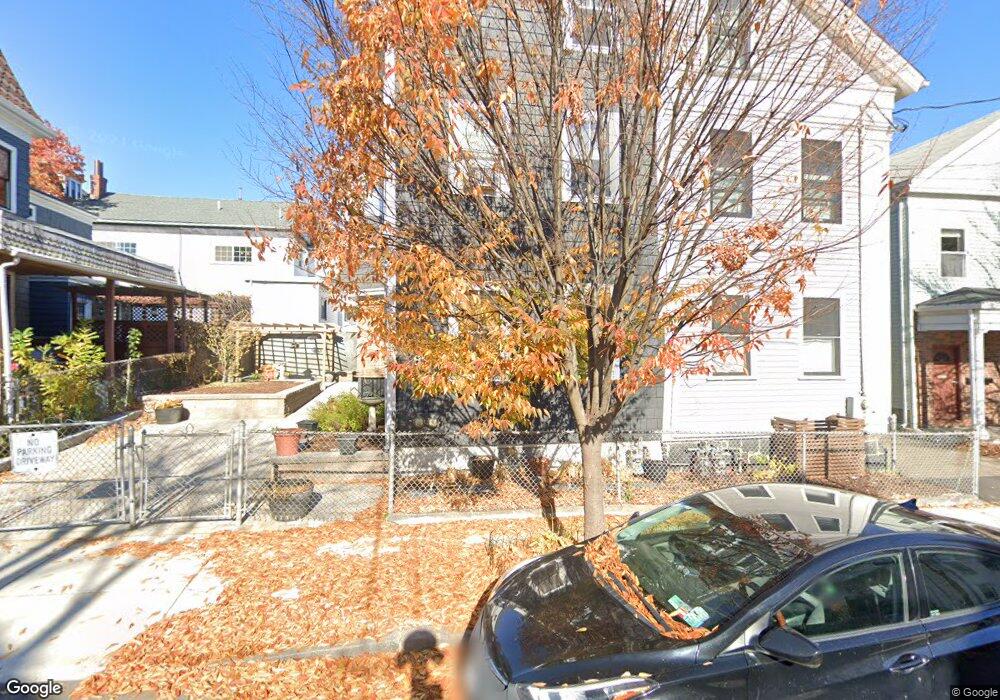
79 Thorndike St Cambridge, MA 02141
East Cambridge NeighborhoodEstimated Value: $1,615,000 - $1,920,076
3
Beds
3
Baths
2,629
Sq Ft
$677/Sq Ft
Est. Value
About This Home
This home is located at 79 Thorndike St, Cambridge, MA 02141 and is currently estimated at $1,779,019, approximately $676 per square foot. 79 Thorndike St is a home located in Middlesex County with nearby schools including Community Charter School of Cambridge, Torit Montessori School, and Boston Children's School.
Ownership History
Date
Name
Owned For
Owner Type
Purchase Details
Closed on
Jun 23, 1992
Sold by
Est Mccaigue Sadie
Bought by
Mirliani Frederick and Friedman Martha
Current Estimated Value
Home Financials for this Owner
Home Financials are based on the most recent Mortgage that was taken out on this home.
Original Mortgage
$126,000
Interest Rate
8.67%
Mortgage Type
Purchase Money Mortgage
Create a Home Valuation Report for This Property
The Home Valuation Report is an in-depth analysis detailing your home's value as well as a comparison with similar homes in the area
Home Values in the Area
Average Home Value in this Area
Purchase History
| Date | Buyer | Sale Price | Title Company |
|---|---|---|---|
| Mirliani Frederick | $82,500 | -- |
Source: Public Records
Mortgage History
| Date | Status | Borrower | Loan Amount |
|---|---|---|---|
| Open | Mirliani Frederick | $130,000 | |
| Closed | Mirliani Frederick | $14,000 | |
| Closed | Mirliani Frederick | $126,000 |
Source: Public Records
Tax History
| Year | Tax Paid | Tax Assessment Tax Assessment Total Assessment is a certain percentage of the fair market value that is determined by local assessors to be the total taxable value of land and additions on the property. | Land | Improvement |
|---|---|---|---|---|
| 2025 | $9,849 | $1,551,100 | $568,100 | $983,000 |
| 2024 | $9,193 | $1,552,900 | $606,900 | $946,000 |
| 2023 | $8,202 | $1,399,600 | $565,500 | $834,100 |
| 2022 | $7,840 | $1,324,300 | $588,400 | $735,900 |
| 2021 | $7,374 | $1,260,500 | $564,900 | $695,600 |
| 2020 | $7,196 | $1,251,400 | $569,100 | $682,300 |
| 2019 | $2,714 | $1,192,300 | $558,200 | $634,100 |
| 2018 | $4,550 | $1,049,700 | $462,900 | $586,800 |
| 2017 | $6,248 | $962,700 | $413,900 | $548,800 |
| 2016 | $5,826 | $833,500 | $324,000 | $509,500 |
| 2015 | $5,696 | $728,400 | $277,700 | $450,700 |
| 2014 | $5,170 | $617,000 | $215,100 | $401,900 |
Source: Public Records
Map
Nearby Homes
- 78 Otis St
- 76-78 Thorndike St
- 93 Third St
- 96 Otis St Unit 1
- 50 Spring St
- 68 Gore St
- 30
- 30 2nd St Unit B
- 30 2nd St Unit A
- 17 Otis St Unit 602
- 169 Monsignor Obrien Hwy Unit 605
- 262 Monsignor Obrien Hwy Unit 503
- 59 7th St
- 59 7th St Unit 2
- 59 7th St Unit 1
- 59 7th St Unit 3
- 47-53R 8th St
- 6 Canal Park Unit 602
- 6 Canal Park Unit 105
- 4 Canal Park Unit PH9
- 75 Thorndike St Unit FL1-ID1238041P
- 75 Thorndike St Unit ID1238041P
- 75 Thorndike St Unit ID1238168P
- 75 Thorndike St Unit 75
- 75 Thorndike St
- 75 Thorndike St Unit 2
- 75 Thorndike St Unit 2A
- 75 Thorndike St Unit 2Furnished
- 75 Thorndike St
- 75 Thorndike St Unit 1
- 77 Thorndike St
- 77 Thorndike St Unit 1
- 77 Thorndike St Unit 2
- 81 Thorndike St
- 74 Sciarappa St
- 83 Thorndike St
- 72 Sciarappa St
- 71 Thorndike St
- 73 Thorndike St
- 71 Thorndike St
Your Personal Tour Guide
Ask me questions while you tour the home.