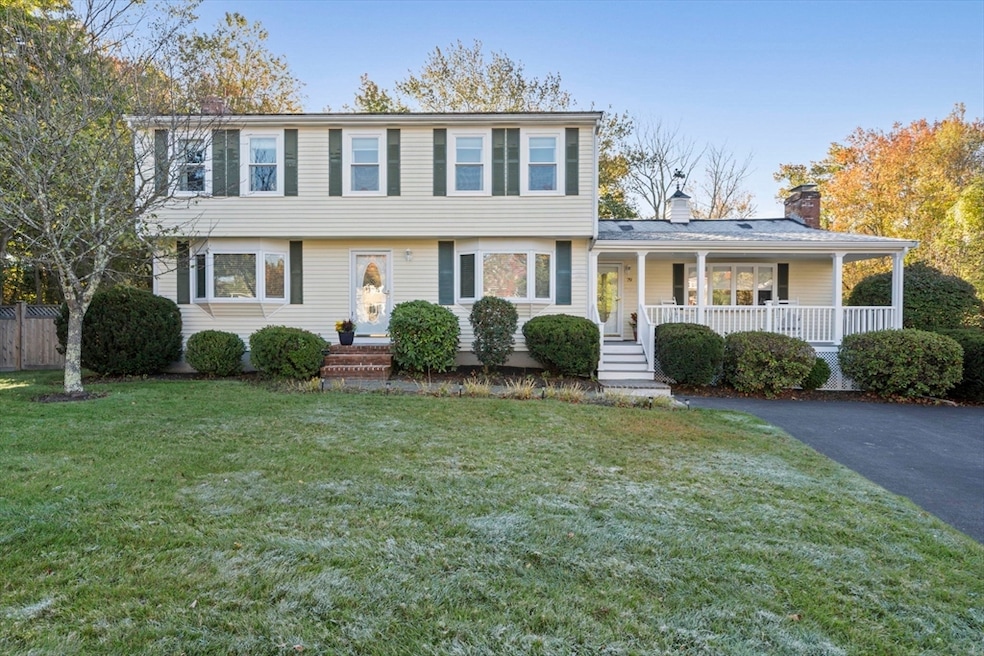


79 Tilden Rd South Weymouth, MA 02190
South Weymouth NeighborhoodEstimated payment $4,965/month
Highlights
- Marina
- Medical Services
- Open Floorplan
- Golf Course Community
- In Ground Pool
- Colonial Architecture
About This Home
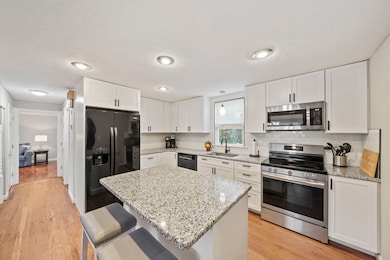
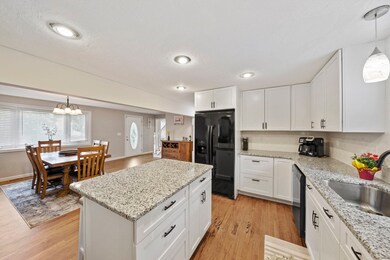
Lovingly cared for by the same family for 22 years, this inviting South Weymouth Colonial is ready for its next chapter. Designed for entertaining, this home welcomes you with a charming composite porch leading into a bright, updated kitchen and dining area. The spacious family room features vaulted ceilings, exposed beams, a wood-burning fireplace, and a wet bar, perfect for gatherings. A new oversized slider opens to an expansive deck overlooking the in-ground gunite heated swimming pool and large yard. A cozy living room offers another spot to relax, and a half bath with laundry completes the main level. Upstairs, you’ll find four bedrooms, including a primary with double closets, plus a full bath. The finished lower level offers bonus space ideal for a home office, gym, or playroom. Central air and a new roof add to its appeal. This prime location is minutes to the highway, Derby Street shops, and restaurants, and perfectly combines comfort, style, and convenience.

Home Details
Home Type
- Single Family
Est. Annual Taxes
- $7,456
Year Built
- Built in 1982 | Remodeled
Lot Details
- 0.4 Acre Lot
- Fenced
- Property is zoned R-6
Home Design
- Colonial Architecture
- Frame Construction
- Shingle Roof
- Concrete Perimeter Foundation
Interior Spaces
- 2,084 Sq Ft Home
- Open Floorplan
- Wet Bar
- Beamed Ceilings
- Tray Ceiling
- Vaulted Ceiling
- Ceiling Fan
- Recessed Lighting
- Light Fixtures
- Picture Window
- Sliding Doors
- Family Room with Fireplace
- Dining Area
- Bonus Room
- Wood Flooring
Kitchen
- Range
- Dishwasher
- Kitchen Island
- Solid Surface Countertops
Bedrooms and Bathrooms
- 4 Bedrooms
- Primary bedroom located on second floor
- Dual Closets
Laundry
- Laundry on main level
- Dryer
- Washer
Partially Finished Basement
- Basement Fills Entire Space Under The House
- Interior Basement Entry
- Sump Pump
Parking
- 4 Car Parking Spaces
- Driveway
- Paved Parking
- Open Parking
- Off-Street Parking
Outdoor Features
- In Ground Pool
- Bulkhead
- Deck
- Patio
- Outdoor Storage
- Porch
Location
- Property is near public transit
- Property is near schools
Utilities
- Central Air
- Heating System Uses Oil
- Baseboard Heating
- 200+ Amp Service
- Water Heater
- Internet Available
Listing and Financial Details
- Assessor Parcel Number M:51 B:539 L:044,285163
Community Details
Overview
- No Home Owners Association
- Near Conservation Area
Amenities
- Medical Services
- Shops
- Coin Laundry
Recreation
- Marina
- Golf Course Community
- Tennis Courts
- Community Pool
- Park
- Jogging Path
Map
Home Values in the Area
Average Home Value in this Area
Tax History
| Year | Tax Paid | Tax Assessment Tax Assessment Total Assessment is a certain percentage of the fair market value that is determined by local assessors to be the total taxable value of land and additions on the property. | Land | Improvement |
|---|---|---|---|---|
| 2025 | $7,456 | $738,200 | $240,700 | $497,500 |
| 2024 | $7,227 | $703,700 | $229,300 | $474,400 |
| 2023 | $6,832 | $653,800 | $231,600 | $422,200 |
| 2022 | $6,701 | $584,700 | $214,500 | $370,200 |
| 2021 | $6,257 | $533,000 | $214,500 | $318,500 |
| 2020 | $6,009 | $504,100 | $214,500 | $289,600 |
| 2019 | $5,865 | $483,900 | $206,200 | $277,700 |
| 2018 | $5,639 | $451,100 | $196,400 | $254,700 |
| 2017 | $5,511 | $430,200 | $187,100 | $243,100 |
| 2016 | $5,300 | $414,100 | $179,900 | $234,200 |
| 2015 | $5,116 | $396,600 | $179,900 | $216,700 |
| 2014 | $4,906 | $368,900 | $167,400 | $201,500 |
Property History
| Date | Event | Price | List to Sale | Price per Sq Ft |
|---|---|---|---|---|
| 10/20/2025 10/20/25 | Pending | -- | -- | -- |
| 10/14/2025 10/14/25 | For Sale | $825,000 | -- | $396 / Sq Ft |
Purchase History
| Date | Type | Sale Price | Title Company |
|---|---|---|---|
| Deed | $405,000 | -- | |
| Deed | $260,000 | -- | |
| Deed | $202,000 | -- |
Mortgage History
| Date | Status | Loan Amount | Loan Type |
|---|---|---|---|
| Open | $275,000 | Purchase Money Mortgage | |
| Previous Owner | $208,000 | Purchase Money Mortgage | |
| Previous Owner | $128,000 | No Value Available | |
| Previous Owner | $36,850 | No Value Available |
Source: MLS Property Information Network (MLS PIN)
MLS Number: 73443431
APN: WEYM-000051-000539-000044
Disclaimer: Certain information contained herein is derived from information provided by parties other than Homes.com. All information provided is deemed reliable, but is not guaranteed to be accurate and should be independently verified.
![]() The property listing data and information, or the Images, set forth herein were provided to MLS Property Information Network, Inc. from third party sources, including sellers, lessors and public records, and were compiled by MLS Property Information Network, Inc. The property listing data and information, and the Images, are for the personal, non-commercial use of consumers having a good faith interest in purchasing or leasing listed properties of the type displayed to them and may not be used for any purpose other than to identify prospective properties which such consumers may have a good faith interest in purchasing or leasing. MLS Property Information Network, Inc. and its subscribers disclaim any and all representations and warranties as to the accuracy of the property listing data and information, or as to the accuracy of any of the Images, set forth herein.
The property listing data and information, or the Images, set forth herein were provided to MLS Property Information Network, Inc. from third party sources, including sellers, lessors and public records, and were compiled by MLS Property Information Network, Inc. The property listing data and information, and the Images, are for the personal, non-commercial use of consumers having a good faith interest in purchasing or leasing listed properties of the type displayed to them and may not be used for any purpose other than to identify prospective properties which such consumers may have a good faith interest in purchasing or leasing. MLS Property Information Network, Inc. and its subscribers disclaim any and all representations and warranties as to the accuracy of the property listing data and information, or as to the accuracy of any of the Images, set forth herein.
- 4 Edward Cody Ln
- 18 Ben Hogan Landing Unit 18
- 17 Buchanan Ln
- 15 Ranger Cir
- 540 Union St
- 279 Pine St
- 299 Union St
- 102 White St
- 25 Wales Ave
- 197 White St
- 376 Pleasant St
- 18 Whiting Ln
- 261 Pleasant St Unit 5
- 45 Union St
- 65 Boxberry Ln
- 82 Snowbird Ave
- 110 Burkhall St Unit H
- 7 Boxberry Ln Unit 7
- 120 Burkhall St Unit K
- 60 Greentree Ln Unit 38