79 Tyler St Boston, MA 02111
Chinatown NeighborhoodEstimated Value: $1,304,791
About This Home
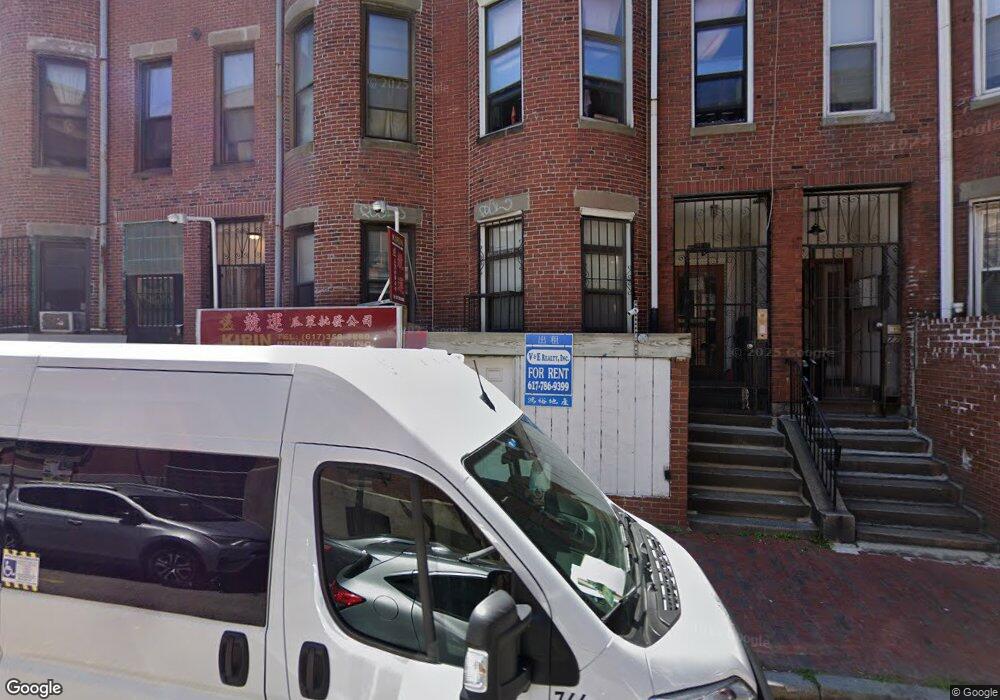
This home is located at 79 Tyler St, Boston, MA 02111 and is currently estimated at $1,304,791, approximately $1,482 per square foot. 79 Tyler St is a home located in Suffolk County with nearby schools including Park Street School, Kingsley Montessori School, and Cathedral High School.
Ownership History
We collect this data history from publicly available records. To have your information removed, we recommend requesting removal directly through your county’s website.
Purchase Details
Purchase Details
Home Financials for this Owner
Home Financials are based on the most recent Mortgage that was taken out on this home.Home Values in the Area
Average Home Value in this Area
Purchase History
We collect this data history from publicly available records. To have your information removed, we recommend requesting removal directly through your county’s website.
| Date | Buyer | Sale Price | Title Company |
|---|---|---|---|
| $450,000 | -- | ||
| $450,000 | -- | ||
| $230,000 | -- | ||
| $230,000 | -- |
Mortgage History
We collect this data history from publicly available records. To have your information removed, we recommend requesting removal directly through your county’s website.
| Date | Status | Borrower | Loan Amount |
|---|---|---|---|
| Previous Owner | $220,000 | ||
| Previous Owner | $700,000 |
Tax History
We collect this data history from publicly available records. To have your information removed, we recommend requesting removal directly through your county’s website.
| Year | Tax Paid | Tax Assessment Tax Assessment Total Assessment is a certain percentage of the fair market value that is determined by local assessors to be the total taxable value of land and additions on the property. | Land | Improvement |
|---|---|---|---|---|
| 2025 | -- | $829,300 | $329,800 | $499,500 |
| 2024 | -- | $856,000 | $329,800 | $526,200 |
| 2023 | $0 | $894,500 | $329,800 | $564,700 |
| 2022 | $0 | $840,300 | $329,800 | $510,500 |
| 2021 | $0 | $842,400 | $251,200 | $591,200 |
| 2020 | $0 | $807,700 | $251,200 | $556,500 |
| 2019 | $0 | $777,000 | $251,200 | $525,800 |
| 2018 | $0 | $744,000 | $246,800 | $497,200 |
| 2017 | $0 | $725,000 | $235,300 | $489,700 |
| 2016 | -- | $671,500 | $218,000 | $453,500 |
| 2015 | -- | $598,000 | $194,900 | $403,100 |
| 2014 | -- | $540,500 | $158,800 | $381,700 |
Map
- 74 Tyler St Unit C
- 104-104A Tyler St
- 1 Nassau St Unit 1607
- 1 Nassau St Unit 1103
- 65-65A Beach St
- 703 Washington St
- 111 Beach St Unit 3E
- 121-123 Beach St Unit 803
- 121-123 Beach St Unit 801
- 55 Lagrange St Unit 1010
- 55 Lagrange St Unit 1202
- 55 Lagrange St Unit 1701
- 55 Lagrange St Unit 409
- 55 Lagrange St Unit 1005
- 55 Lagrange St Unit 1902
- 210 South St Unit 32
- 2 Lyndeboro Place
- 110 Stuart St Unit 23B
- 110 Stuart St Unit 19H
- 110 Stuart St Unit 21B
- 81 Tyler St Unit 2
- 81 Tyler St Unit 4
- 81 Tyler St Unit 3
- 83 Tyler St
- 85 Tyler St
- 85 Tyler St Unit 2
- 77 Tyler St Unit C
- 77 Tyler St Unit 4
- 77 Tyler St Unit 3
- 77 Tyler St Unit 2
- 77 Tyler St Unit 1
- 77 Tyler St
- 77 Tyler St
- 77 Tyler St Unit 77
- 73 Tyler St Unit 2
- 87 Tyler St
- 78 Tyler St
- 74 Tyler St Unit E
- 74 Tyler St Unit D
- 74 Tyler St Unit B
Ask me questions while you tour the home.