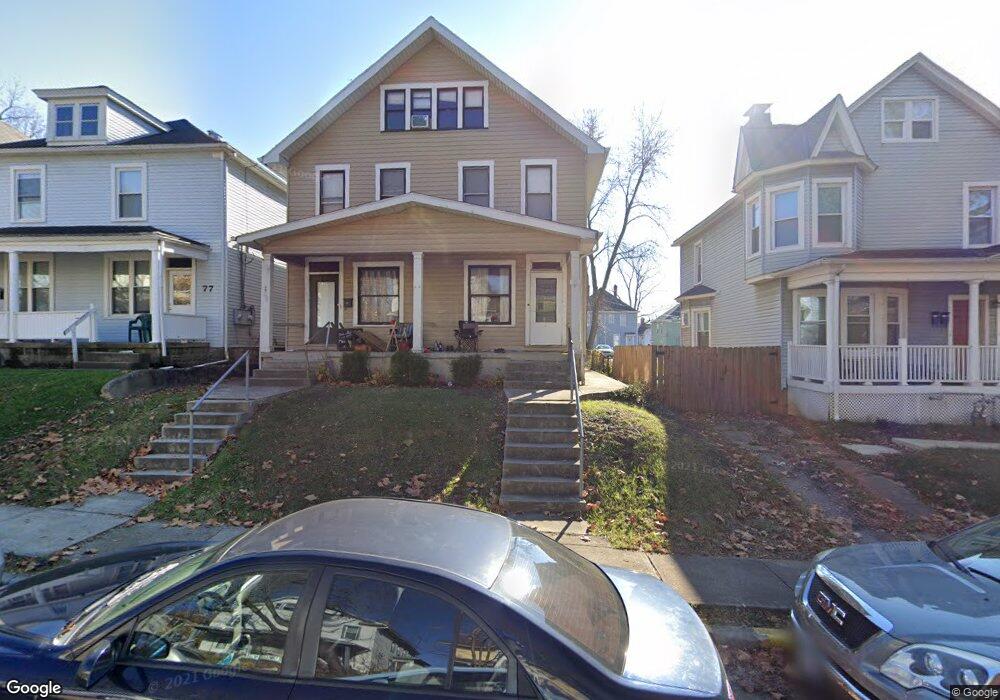
79 W Blake Ave Unit 81 Columbus, OH 43202
Old North Columbus NeighborhoodEstimated Value: $418,000 - $538,000
6
Beds
2
Baths
2,841
Sq Ft
$169/Sq Ft
Est. Value
About This Home
This home is located at 79 W Blake Ave Unit 81, Columbus, OH 43202 and is currently estimated at $481,429, approximately $169 per square foot. 79 W Blake Ave Unit 81 is a home located in Franklin County with nearby schools including Hubbard Elementary School, Dominion Middle School, and Whetstone High School.
Ownership History
Date
Name
Owned For
Owner Type
Purchase Details
Closed on
Feb 27, 2020
Sold by
Byrne Maureen T
Bought by
79 81 W Blake Llc
Current Estimated Value
Purchase Details
Closed on
Nov 26, 2019
Sold by
79 81 W Blake Llc
Bought by
Byrne Maureen T
Home Financials for this Owner
Home Financials are based on the most recent Mortgage that was taken out on this home.
Original Mortgage
$137,500
Interest Rate
3.7%
Mortgage Type
New Conventional
Purchase Details
Closed on
Jul 21, 2014
Sold by
Byrne John J and Byrne Maureen
Bought by
79 81 W Blake Llc
Purchase Details
Closed on
Oct 12, 1995
Sold by
Vongruenigen John
Bought by
Byrne Maureen T and Byrne John J
Home Financials for this Owner
Home Financials are based on the most recent Mortgage that was taken out on this home.
Original Mortgage
$74,250
Interest Rate
7.8%
Mortgage Type
New Conventional
Purchase Details
Closed on
Oct 29, 1990
Create a Home Valuation Report for This Property
The Home Valuation Report is an in-depth analysis detailing your home's value as well as a comparison with similar homes in the area
Home Values in the Area
Average Home Value in this Area
Purchase History
| Date | Buyer | Sale Price | Title Company |
|---|---|---|---|
| 79 81 W Blake Llc | -- | None Available | |
| Byrne Maureen T | -- | Landsel Title Agency Inc | |
| 79 81 W Blake Llc | -- | None Available | |
| Byrne Maureen T | $82,500 | -- | |
| -- | $64,000 | -- |
Source: Public Records
Mortgage History
| Date | Status | Borrower | Loan Amount |
|---|---|---|---|
| Previous Owner | Byrne Maureen T | $137,500 | |
| Previous Owner | Byrne Maureen T | $74,250 |
Source: Public Records
Tax History Compared to Growth
Tax History
| Year | Tax Paid | Tax Assessment Tax Assessment Total Assessment is a certain percentage of the fair market value that is determined by local assessors to be the total taxable value of land and additions on the property. | Land | Improvement |
|---|---|---|---|---|
| 2024 | $6,750 | $147,290 | $34,760 | $112,530 |
| 2023 | $6,816 | $147,280 | $34,755 | $112,525 |
| 2022 | $5,382 | $98,460 | $25,340 | $73,120 |
| 2021 | $5,392 | $98,460 | $25,340 | $73,120 |
| 2020 | $5,250 | $98,460 | $25,340 | $73,120 |
| 2019 | $5,047 | $78,760 | $20,270 | $58,490 |
| 2018 | $4,484 | $78,760 | $20,270 | $58,490 |
| 2017 | $4,946 | $78,760 | $20,270 | $58,490 |
| 2016 | $4,316 | $63,530 | $17,050 | $46,480 |
| 2015 | $3,929 | $63,530 | $17,050 | $46,480 |
| 2014 | $3,939 | $63,530 | $17,050 | $46,480 |
| 2013 | $2,034 | $66,500 | $15,505 | $50,995 |
Source: Public Records
Map
Nearby Homes
- 6 E Blake Ave
- 185 E Tompkins St
- 116-118 E Hudson St
- 198 E Maynard Ave
- 69-71 E Duncan St
- 2537 Medary Ave Unit 539
- 241 E Blake Ave
- 223-225 E Maynard Ave
- 223 E Patterson Ave
- 109-117 E Arcadia Ave
- 217 E Oakland Ave
- 9 E Norwich Ave Unit 15
- 2627 Neil Ave
- 2584 Deming Ave
- 2350 Indiana Ave
- 360-364 E Tompkins St
- 2251 Indiana Ave
- 328 Wyandotte Ave Unit 326
- 2395 Summit St Unit 397
- 2241 Indiana Ave
- 73 W Blake Ave Unit 75
- 73 W Blake Ave
- 79 E Blake Ave
- 73 E Blake Ave
- 85 E Blake Ave
- 93 E Blake Ave
- 55 E Blake Ave
- 97 E Blake Ave
- 80 E Blake Ave
- 84 E Blake Ave
- 90 E Blake Ave
- 94 E Blake Ave
- 98 E Blake Ave
- 2403 Findley Ave
- 76 E Blake Ave
- 72 E Blake Ave Unit 10
- 72 E Blake Ave
- 68 E Blake Ave
- 68 E Blake Ave Unit 2
- 2402 East Ave