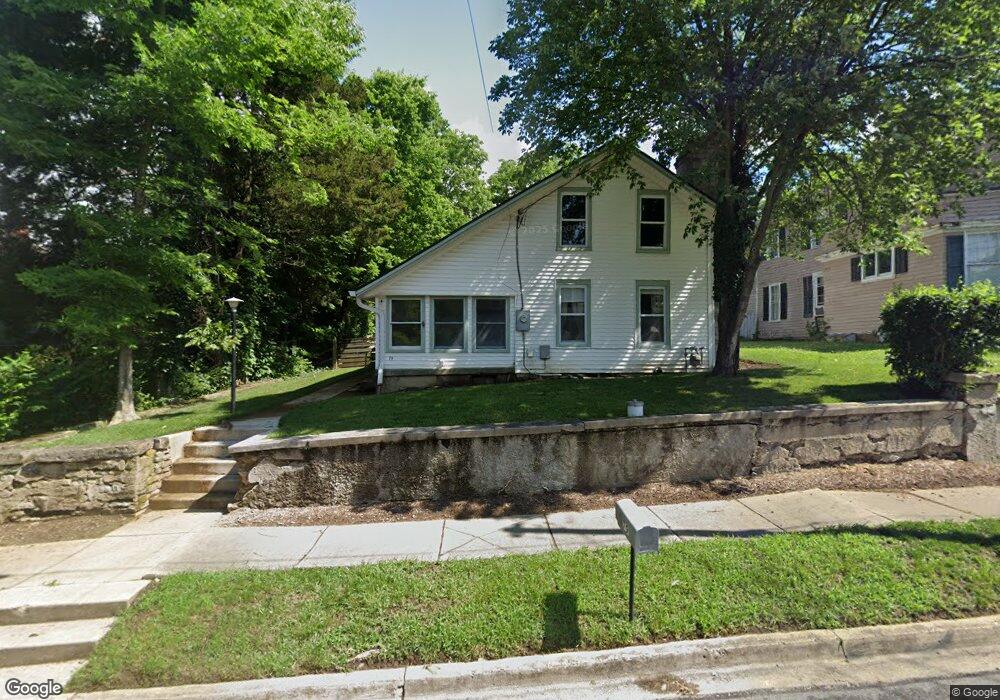
79 W Salem St Clayton, OH 45315
Estimated Value: $83,000 - $161,336
2
Beds
1
Bath
1,040
Sq Ft
$110/Sq Ft
Est. Value
About This Home
This home is located at 79 W Salem St, Clayton, OH 45315 and is currently estimated at $114,084, approximately $109 per square foot. 79 W Salem St is a home located in Montgomery County with nearby schools including Northmoor Elementary School, Northmont High School, and Salem Christian Academy.
Ownership History
Date
Name
Owned For
Owner Type
Purchase Details
Closed on
Jul 1, 2020
Sold by
Real Solutions Property Management Llc
Bought by
Brown Aaron and Brown Tracy L
Current Estimated Value
Purchase Details
Closed on
Jan 29, 2020
Sold by
Drye Andrew and Drye Moallister Andrea
Bought by
Real Solutions Property Management
Purchase Details
Closed on
Mar 3, 2008
Sold by
Fenton Justin F
Bought by
Fenton Frank M and Fenton Cynthia L
Purchase Details
Closed on
Nov 9, 2004
Sold by
Hutchinson Charles D and Fenton Wesley A
Bought by
Fenton Justin F
Home Financials for this Owner
Home Financials are based on the most recent Mortgage that was taken out on this home.
Original Mortgage
$39,600
Interest Rate
5.8%
Mortgage Type
Purchase Money Mortgage
Purchase Details
Closed on
Oct 31, 2001
Sold by
Hutchinson Charles D and Hutchinson Donald
Bought by
Hutchinson Charles D
Create a Home Valuation Report for This Property
The Home Valuation Report is an in-depth analysis detailing your home's value as well as a comparison with similar homes in the area
Home Values in the Area
Average Home Value in this Area
Purchase History
| Date | Buyer | Sale Price | Title Company |
|---|---|---|---|
| Brown Aaron | $35,000 | Fidelity Lawyers Ttl Agcy Ll | |
| Real Solutions Property Management | $15,000 | None Available | |
| Fenton Frank M | -- | Midwest Title Company | |
| Fenton Justin F | $60,000 | None Available | |
| Hutchinson Charles D | -- | -- |
Source: Public Records
Mortgage History
| Date | Status | Borrower | Loan Amount |
|---|---|---|---|
| Previous Owner | Fenton Justin F | $39,600 |
Source: Public Records
Tax History Compared to Growth
Tax History
| Year | Tax Paid | Tax Assessment Tax Assessment Total Assessment is a certain percentage of the fair market value that is determined by local assessors to be the total taxable value of land and additions on the property. | Land | Improvement |
|---|---|---|---|---|
| 2024 | $2,179 | $37,090 | $4,960 | $32,130 |
| 2023 | $2,179 | $37,090 | $4,960 | $32,130 |
| 2022 | $1,994 | $25,940 | $3,470 | $22,470 |
| 2021 | $1,999 | $25,940 | $3,470 | $22,470 |
| 2020 | $1,996 | $25,940 | $3,470 | $22,470 |
| 2019 | $2,093 | $24,520 | $4,330 | $20,190 |
| 2018 | $2,099 | $24,520 | $4,330 | $20,190 |
| 2017 | $2,085 | $24,520 | $4,330 | $20,190 |
| 2016 | $1,942 | $22,350 | $3,470 | $18,880 |
| 2015 | $1,787 | $22,350 | $3,470 | $18,880 |
| 2014 | $1,787 | $22,350 | $3,470 | $18,880 |
| 2012 | -- | $23,950 | $3,350 | $20,600 |
Source: Public Records
Map
Nearby Homes
- 558 Clinton St
- 7776 Crestway Rd
- 7415 Pleasant Plain Rd
- 7710 Crestway Dr
- 7980 Parsley Place
- 6543 Brookville Salem Rd
- 5769 Dill Blvd
- 7739 Cilantro Way
- 7746 Cilantro Way
- 7706 Cilantro Way
- Chatham Plan at Wenger Village
- Milford Plan at Wenger Village
- Holcombe Plan at Wenger Village
- Newcastle Plan at Wenger Village
- Pendleton Plan at Wenger Village
- Bellamy Plan at Wenger Village
- Henley Plan at Wenger Village
- 7754 Cilantro Way
- 7750 Cilantro Way
- 508 Korner Ave