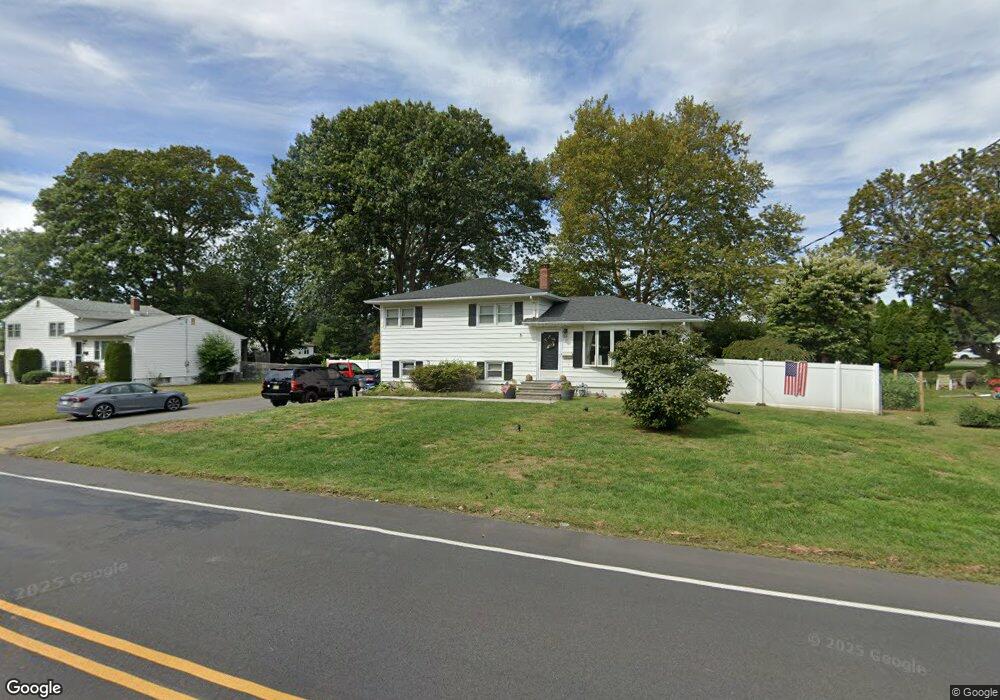
79 Wall St West Long Branch, NJ 07764
Estimated Value: $900,000 - $936,000
5
Beds
1
Bath
2,148
Sq Ft
$426/Sq Ft
Est. Value
About This Home
This home is located at 79 Wall St, West Long Branch, NJ 07764 and is currently estimated at $914,787, approximately $425 per square foot. 79 Wall St is a home located in Monmouth County with nearby schools including Betty McElmon Elementary School, Frank Antonides School, and Shore Regional High School.
Ownership History
Date
Name
Owned For
Owner Type
Purchase Details
Closed on
Jun 6, 2007
Sold by
Scala Jo Ann
Bought by
Stevenson John and Stevenson Molly C
Current Estimated Value
Home Financials for this Owner
Home Financials are based on the most recent Mortgage that was taken out on this home.
Original Mortgage
$397,000
Interest Rate
6.67%
Mortgage Type
Balloon
Purchase Details
Closed on
Apr 17, 2003
Sold by
Edelman Guy
Bought by
Scala Jo Ann
Home Financials for this Owner
Home Financials are based on the most recent Mortgage that was taken out on this home.
Original Mortgage
$130,000
Interest Rate
5.53%
Create a Home Valuation Report for This Property
The Home Valuation Report is an in-depth analysis detailing your home's value as well as a comparison with similar homes in the area
Home Values in the Area
Average Home Value in this Area
Purchase History
| Date | Buyer | Sale Price | Title Company |
|---|---|---|---|
| Stevenson John | $397,000 | Fidelity Natl Title Ins Co | |
| Scala Jo Ann | $330,000 | -- |
Source: Public Records
Mortgage History
| Date | Status | Borrower | Loan Amount |
|---|---|---|---|
| Previous Owner | Stevenson John | $397,000 | |
| Previous Owner | Scala Jo Ann | $130,000 |
Source: Public Records
Tax History Compared to Growth
Tax History
| Year | Tax Paid | Tax Assessment Tax Assessment Total Assessment is a certain percentage of the fair market value that is determined by local assessors to be the total taxable value of land and additions on the property. | Land | Improvement |
|---|---|---|---|---|
| 2025 | $10,192 | $821,900 | $471,800 | $350,100 |
| 2024 | $9,934 | $782,200 | $410,500 | $371,700 |
| 2023 | $9,934 | $711,100 | $360,000 | $351,100 |
| 2022 | $8,076 | $608,700 | $270,000 | $338,700 |
| 2021 | $8,076 | $417,800 | $202,500 | $215,300 |
| 2020 | $8,023 | $390,400 | $180,000 | $210,400 |
| 2019 | $7,955 | $389,200 | $180,000 | $209,200 |
| 2018 | $7,840 | $370,500 | $171,000 | $199,500 |
| 2017 | $8,075 | $364,400 | $171,000 | $193,400 |
| 2016 | $7,396 | $340,500 | $182,300 | $158,200 |
| 2015 | $7,317 | $336,400 | $182,300 | $154,100 |
| 2014 | $7,191 | $308,500 | $148,500 | $160,000 |
Source: Public Records
Map
Nearby Homes
- 11 Fairway Ave
- 54 Wall St
- 21 Dennis St
- 57 Hollywood Ave
- 317 Norwood Ave
- 264 Norwood Ave
- 2 Hilltop Rd
- 570 Monmouth Place
- 440 W End Ave
- 448 Monmouth Place
- 8 Norwood Ct
- 489 Cedar Ave
- 388 Brookdale Ave
- 120 Beechwood Ave
- 552 Westwood Ave
- 182 Wall St
- 521 Cedar Ave
- 497 Norwood Ave
- 537 Cedar Ave
- 497 Marvin Dr