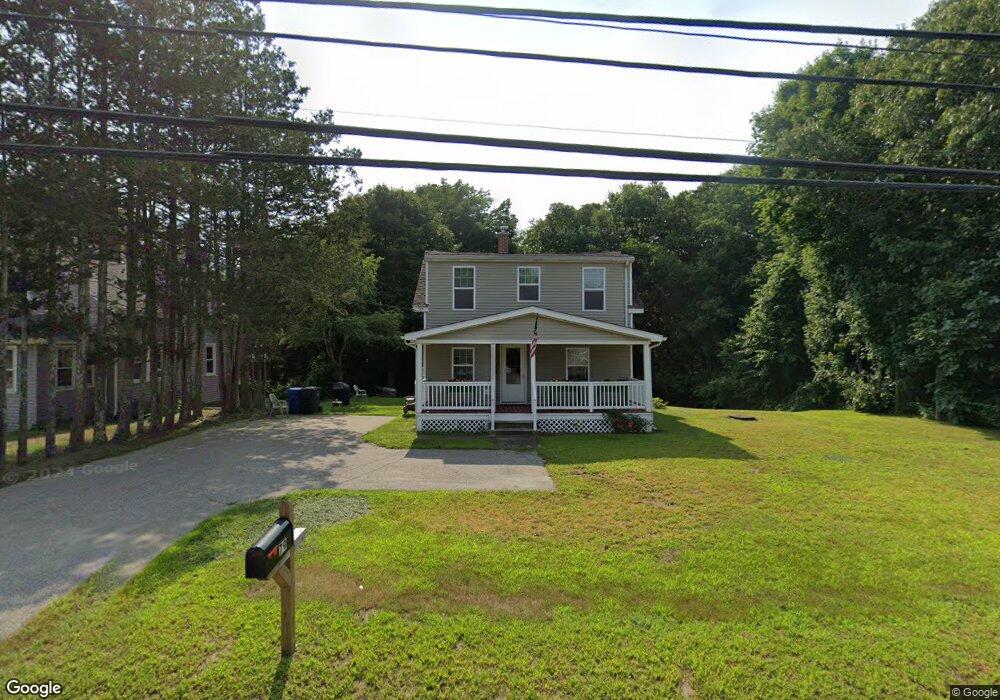
79 Wauregan Rd Danielson, CT 06239
Estimated Value: $254,000 - $336,000
3
Beds
2
Baths
1,227
Sq Ft
$251/Sq Ft
Est. Value
About This Home
This home is located at 79 Wauregan Rd, Danielson, CT 06239 and is currently estimated at $307,446, approximately $250 per square foot. 79 Wauregan Rd is a home located in Windham County with nearby schools including Killingly Central School, Killingly Memorial School, and Killingly Intermediate School.
Ownership History
Date
Name
Owned For
Owner Type
Purchase Details
Closed on
Jun 2, 2010
Sold by
T&S Homes Llc
Bought by
Stone Denise L
Current Estimated Value
Home Financials for this Owner
Home Financials are based on the most recent Mortgage that was taken out on this home.
Original Mortgage
$152,900
Outstanding Balance
$100,082
Interest Rate
4.5%
Mortgage Type
FHA
Estimated Equity
$207,364
Purchase Details
Closed on
Dec 31, 2009
Sold by
Sadowsky Jeremy J and Tatro Glen M
Bought by
T&S Homes Llc
Purchase Details
Closed on
Oct 9, 2009
Sold by
Deutsche Bk
Bought by
Sandowski Jeremy J and Tatro Glen M
Purchase Details
Closed on
Jul 9, 2009
Sold by
Houghton Ricky A
Bought by
Tribeca Lending Corp
Purchase Details
Closed on
Nov 3, 1997
Sold by
Montgomery Robert D and Montgomery Eleanor M
Bought by
Houghton Ricky A and Ernest Kelly J
Create a Home Valuation Report for This Property
The Home Valuation Report is an in-depth analysis detailing your home's value as well as a comparison with similar homes in the area
Home Values in the Area
Average Home Value in this Area
Purchase History
| Date | Buyer | Sale Price | Title Company |
|---|---|---|---|
| Stone Denise L | $155,000 | -- | |
| Stone Denise L | $155,000 | -- | |
| T&S Homes Llc | -- | -- | |
| T & S Homes Llc | -- | -- | |
| Sandowski Jeremy J | $58,000 | -- | |
| Sandowski Jeremy J | $58,000 | -- | |
| Tribeca Lending Corp | -- | -- | |
| Tribeca Lending Corp | -- | -- | |
| Houghton Ricky A | $66,400 | -- | |
| Houghton Ricky A | $66,400 | -- |
Source: Public Records
Mortgage History
| Date | Status | Borrower | Loan Amount |
|---|---|---|---|
| Open | Houghton Ricky A | $20,110 | |
| Open | Houghton Ricky A | $152,900 |
Source: Public Records
Tax History Compared to Growth
Tax History
| Year | Tax Paid | Tax Assessment Tax Assessment Total Assessment is a certain percentage of the fair market value that is determined by local assessors to be the total taxable value of land and additions on the property. | Land | Improvement |
|---|---|---|---|---|
| 2025 | $3,130 | $143,360 | $32,280 | $111,080 |
| 2024 | $2,968 | $143,360 | $32,280 | $111,080 |
| 2023 | $2,894 | $105,700 | $26,390 | $79,310 |
| 2022 | $2,710 | $105,700 | $26,390 | $79,310 |
| 2021 | $2,710 | $105,700 | $26,390 | $79,310 |
| 2020 | $2,657 | $105,700 | $26,390 | $79,310 |
| 2019 | $2,691 | $105,700 | $26,390 | $79,310 |
| 2017 | $2,562 | $92,120 | $20,090 | $72,030 |
| 2016 | $2,562 | $92,120 | $20,090 | $72,030 |
| 2015 | $2,562 | $92,120 | $20,090 | $72,030 |
| 2014 | $2,488 | $92,120 | $20,090 | $72,030 |
Source: Public Records
Map
Nearby Homes
- 69 Wauregan Rd
- 72 Dyer St
- 359 South St
- 110 Franklin St
- 405 South St
- 43 Fall Brook Rd
- 24 Ventura Dr
- 54 Ventura Dr
- 53 Ventura Dr
- 37 Katherine Ave
- 35 S Main St
- 72 Main St
- 102 Cottage St
- 80 Ventura Dr
- 51 Maple St
- 53 S Main St
- 53 Proulx St
- 0 Providence Rd Unit 24080985
- 24 Center St
- 513 Lhomme Street Extension