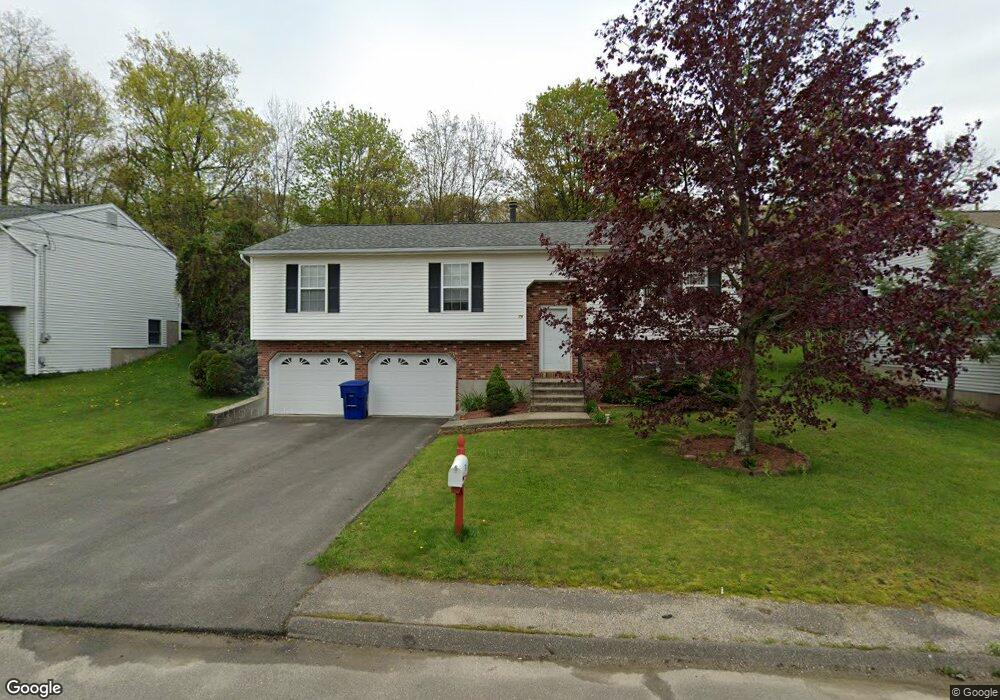
79 Westport Dr Waterbury, CT 06706
South End District NeighborhoodEstimated Value: $315,105 - $374,000
3
Beds
2
Baths
1,236
Sq Ft
$282/Sq Ft
Est. Value
About This Home
This home is located at 79 Westport Dr, Waterbury, CT 06706 and is currently estimated at $348,276, approximately $281 per square foot. 79 Westport Dr is a home located in New Haven County with nearby schools including Wendell L. Cross Elementary School, Michael F. Wallace Middle School, and Crosby High School.
Ownership History
Date
Name
Owned For
Owner Type
Purchase Details
Closed on
Oct 16, 1997
Sold by
Lepore Richard D and Lepore Sheila A
Bought by
Pare Sylvia and Dobbins Robert N
Current Estimated Value
Home Financials for this Owner
Home Financials are based on the most recent Mortgage that was taken out on this home.
Original Mortgage
$72,000
Outstanding Balance
$11,578
Interest Rate
7.46%
Mortgage Type
Purchase Money Mortgage
Estimated Equity
$336,698
Create a Home Valuation Report for This Property
The Home Valuation Report is an in-depth analysis detailing your home's value as well as a comparison with similar homes in the area
Home Values in the Area
Average Home Value in this Area
Purchase History
| Date | Buyer | Sale Price | Title Company |
|---|---|---|---|
| Pare Sylvia | $112,000 | -- |
Source: Public Records
Mortgage History
| Date | Status | Borrower | Loan Amount |
|---|---|---|---|
| Open | Pare Sylvia | $72,000 |
Source: Public Records
Tax History Compared to Growth
Tax History
| Year | Tax Paid | Tax Assessment Tax Assessment Total Assessment is a certain percentage of the fair market value that is determined by local assessors to be the total taxable value of land and additions on the property. | Land | Improvement |
|---|---|---|---|---|
| 2025 | $6,725 | $149,520 | $22,470 | $127,050 |
| 2024 | $7,392 | $149,520 | $22,470 | $127,050 |
| 2023 | $8,102 | $149,520 | $22,470 | $127,050 |
| 2022 | $5,497 | $91,290 | $22,470 | $68,820 |
| 2021 | $5,497 | $91,290 | $22,470 | $68,820 |
| 2020 | $5,497 | $91,290 | $22,470 | $68,820 |
| 2019 | $5,497 | $91,290 | $22,470 | $68,820 |
| 2018 | $5,497 | $91,290 | $22,470 | $68,820 |
| 2017 | $5,769 | $95,820 | $22,460 | $73,360 |
| 2016 | $5,769 | $95,820 | $22,460 | $73,360 |
| 2015 | $5,579 | $95,820 | $22,460 | $73,360 |
| 2014 | $5,579 | $95,820 | $22,460 | $73,360 |
Source: Public Records
Map
Nearby Homes
- 147 Sprucedale Dr
- 185 Eastside Blvd
- 178 Peach Orchard Rd
- 44 Shadybrook Ln
- 562 Piedmont St
- 463 Pearl Lake Rd
- 89 Rockledge Dr
- 335 Raymond St
- 60 Gayfield Rd
- 4 Florence Dr
- 439 Piedmont St
- 65 Clark Hill Rd
- 20 Charlene Dr
- 51 Clover St
- 00 Milton Ave
- 73 Cornelius Ave
- 171 Kelsey St
- 212 Pearl Lake Rd
- 236 Union City Rd
- 0372 Floyd St
- 75 Westport Dr
- 85 Westport Dr
- 78 Westport Dr
- 88 Westport Dr
- 176 Sprucedale Dr
- 72 Westport Dr
- 69 Westport Dr
- 84 Westport Dr
- 170 Sprucedale Dr
- 95 Westport Dr
- 94 Westport Dr
- 162 Sprucedale Dr
- 107 Westport Dr
- 68 Westport Dr
- 63 Westport Dr
- 100 Westport Dr
- 108 Westport Dr
- 101 Westport Dr
- 211 Eastside Blvd
- 173 Sprucedale Dr