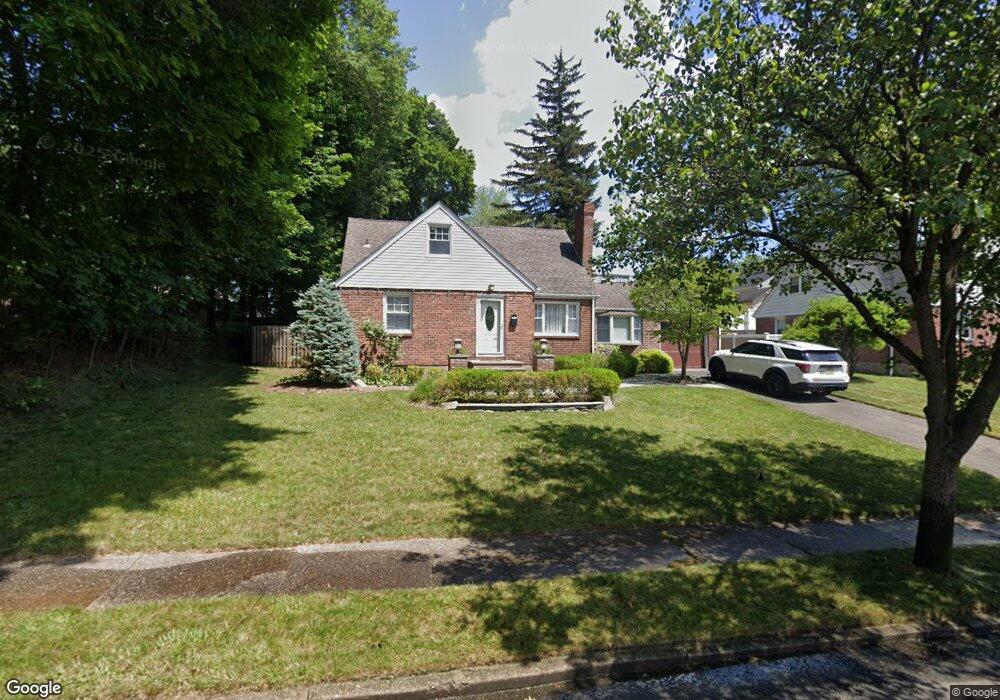
79 Wilcox St Dumont, NJ 07628
Estimated Value: $649,393 - $770,000
--
Bed
--
Bath
1,654
Sq Ft
$423/Sq Ft
Est. Value
About This Home
This home is located at 79 Wilcox St, Dumont, NJ 07628 and is currently estimated at $699,098, approximately $422 per square foot. 79 Wilcox St is a home located in Bergen County with nearby schools including Dumont High School and Institute For Educational Achievement.
Ownership History
Date
Name
Owned For
Owner Type
Purchase Details
Closed on
Jul 13, 2020
Sold by
Marckirii Meghan K
Bought by
Marckini Christopher C
Current Estimated Value
Home Financials for this Owner
Home Financials are based on the most recent Mortgage that was taken out on this home.
Original Mortgage
$373,500
Outstanding Balance
$329,948
Interest Rate
2.9%
Mortgage Type
New Conventional
Estimated Equity
$369,150
Purchase Details
Closed on
Mar 29, 2007
Sold by
Ascolese Eugene
Bought by
Marckini Christopher C
Home Financials for this Owner
Home Financials are based on the most recent Mortgage that was taken out on this home.
Original Mortgage
$320,000
Interest Rate
6.24%
Mortgage Type
New Conventional
Purchase Details
Closed on
Oct 1, 2006
Sold by
Walter Ramstedt Atty In Fact
Bought by
Ascolese Eugene
Home Financials for this Owner
Home Financials are based on the most recent Mortgage that was taken out on this home.
Original Mortgage
$274,500
Interest Rate
6.54%
Create a Home Valuation Report for This Property
The Home Valuation Report is an in-depth analysis detailing your home's value as well as a comparison with similar homes in the area
Home Values in the Area
Average Home Value in this Area
Purchase History
| Date | Buyer | Sale Price | Title Company |
|---|---|---|---|
| Marckini Christopher C | -- | Residential Cmnty Ttl Agcy L | |
| Marckini Christopher C | $400,000 | -- | |
| Ascolese Eugene | $305,000 | -- |
Source: Public Records
Mortgage History
| Date | Status | Borrower | Loan Amount |
|---|---|---|---|
| Open | Marckini Christopher C | $373,500 | |
| Closed | Marckini Christopher C | $320,000 | |
| Previous Owner | Ascolese Eugene | $274,500 |
Source: Public Records
Tax History Compared to Growth
Tax History
| Year | Tax Paid | Tax Assessment Tax Assessment Total Assessment is a certain percentage of the fair market value that is determined by local assessors to be the total taxable value of land and additions on the property. | Land | Improvement |
|---|---|---|---|---|
| 2025 | $12,817 | $658,300 | $311,800 | $346,500 |
| 2024 | $12,502 | $315,300 | $178,000 | $137,300 |
| 2023 | $12,243 | $315,300 | $178,000 | $137,300 |
| 2022 | $12,243 | $315,300 | $178,000 | $137,300 |
| 2021 | $12,183 | $315,300 | $178,000 | $137,300 |
| 2020 | $11,852 | $315,300 | $178,000 | $137,300 |
| 2019 | $11,568 | $315,300 | $178,000 | $137,300 |
| 2018 | $11,332 | $315,300 | $178,000 | $137,300 |
| 2017 | $11,114 | $315,300 | $178,000 | $137,300 |
| 2016 | $10,856 | $315,300 | $178,000 | $137,300 |
| 2015 | $10,607 | $311,800 | $178,000 | $133,800 |
| 2014 | $10,283 | $311,800 | $178,000 | $133,800 |
Source: Public Records
Map
Nearby Homes
- 203 New York Ave
- 40 Depew St
- 136 Elm St
- 23 Cherry Ct
- 181 Phelps Ave
- 79 Blauvelt Ave
- 48 Colonial Pkwy
- 35 Wolcott Rd
- 119 Stonegate Trail
- 280 Hickory Ave
- 139 Stonegate Trail
- 156 E Linden Ave
- 9 New York Ave
- 41 Monument Place
- 12 Spruce St
- 27A Park Ave
- 5 Campi Ct
- 51 Wood Place
- 20 Dojean Ct
- 44 Bogert Place