Estimated Value: $335,000 - $358,000
3
Beds
1
Bath
1,890
Sq Ft
$185/Sq Ft
Est. Value
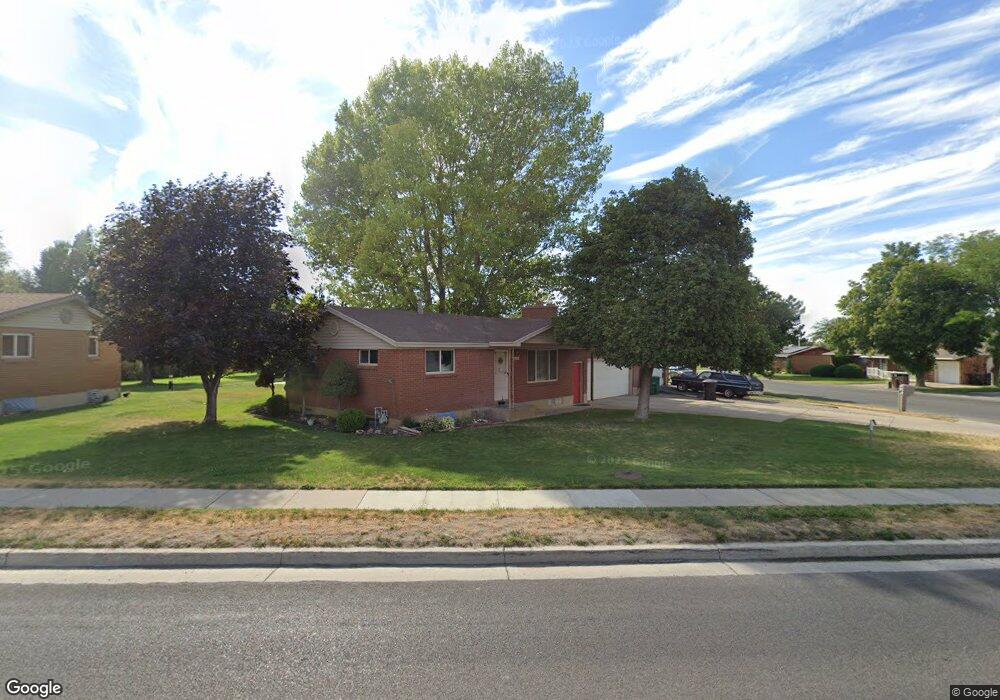
About This Home
This home is located at 790 Anderson Ave, Hyrum, UT 84319 and is currently estimated at $348,721, approximately $184 per square foot. 790 Anderson Ave is a home located in Cache County with nearby schools including Millville School, South Cache Middle School, and Mountain Crest High School.
Ownership History
Date
Name
Owned For
Owner Type
Purchase Details
Closed on
Jan 25, 2019
Sold by
Roderick Curtis J
Bought by
Roderick Curtis J and Roderick Jeanna R
Current Estimated Value
Purchase Details
Closed on
Aug 28, 2012
Sold by
Roderick Curtis J
Bought by
Roderick Curtis J
Home Financials for this Owner
Home Financials are based on the most recent Mortgage that was taken out on this home.
Original Mortgage
$115,826
Outstanding Balance
$80,255
Interest Rate
3.75%
Mortgage Type
FHA
Estimated Equity
$268,466
Purchase Details
Closed on
May 18, 2006
Sold by
Mcbride Jeffrey Farrell and Mcbride Keith H
Bought by
Roderick Curtis J
Home Financials for this Owner
Home Financials are based on the most recent Mortgage that was taken out on this home.
Original Mortgage
$117,500
Interest Rate
6.41%
Mortgage Type
New Conventional
Create a Home Valuation Report for This Property
The Home Valuation Report is an in-depth analysis detailing your home's value as well as a comparison with similar homes in the area
Home Values in the Area
Average Home Value in this Area
Purchase History
| Date | Buyer | Sale Price | Title Company |
|---|---|---|---|
| Roderick Curtis J | -- | Accommodation | |
| Roderick Curtis J | -- | American Secure Title Brigha | |
| Roderick Curtis J | -- | Cache Title Company |
Source: Public Records
Mortgage History
| Date | Status | Borrower | Loan Amount |
|---|---|---|---|
| Open | Roderick Curtis J | $115,826 | |
| Closed | Roderick Curtis J | $117,500 |
Source: Public Records
Tax History Compared to Growth
Tax History
| Year | Tax Paid | Tax Assessment Tax Assessment Total Assessment is a certain percentage of the fair market value that is determined by local assessors to be the total taxable value of land and additions on the property. | Land | Improvement |
|---|---|---|---|---|
| 2025 | $1,215 | $174,485 | $0 | $0 |
| 2024 | $1,297 | $173,970 | $0 | $0 |
| 2023 | $1,454 | $186,450 | $0 | $0 |
| 2022 | $1,699 | $186,450 | $0 | $0 |
| 2021 | $1,573 | $297,710 | $64,360 | $233,350 |
| 2020 | $1,373 | $243,860 | $64,360 | $179,500 |
| 2019 | $1,296 | $216,500 | $37,000 | $179,500 |
| 2018 | $1,095 | $176,800 | $37,000 | $139,800 |
| 2017 | $883 | $74,030 | $0 | $0 |
| 2016 | $903 | $74,030 | $0 | $0 |
| 2015 | $906 | $74,030 | $0 | $0 |
| 2014 | $871 | $72,835 | $0 | $0 |
| 2013 | -- | $71,640 | $0 | $0 |
Source: Public Records
Map
Nearby Homes