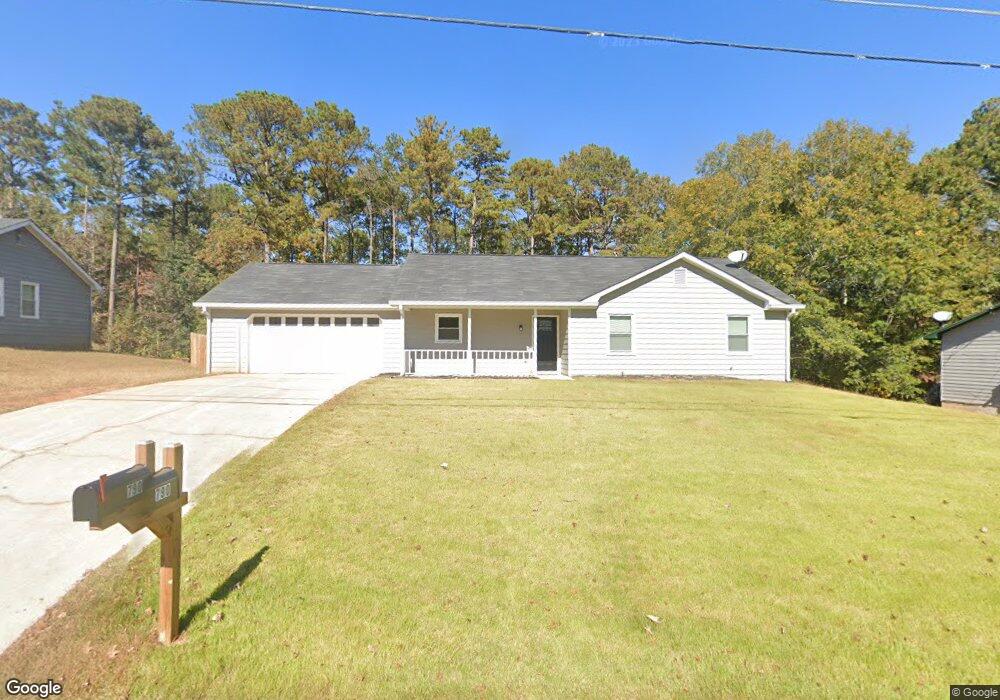
790 Bridgewater Way SE Conyers, GA 30094
Estimated Value: $253,000 - $267,000
3
Beds
2
Baths
1,602
Sq Ft
$162/Sq Ft
Est. Value
About This Home
This home is located at 790 Bridgewater Way SE, Conyers, GA 30094 and is currently estimated at $260,173, approximately $162 per square foot. 790 Bridgewater Way SE is a home located in Rockdale County with nearby schools including Honey Creek Elementary School, Edwards Middle School, and Heritage High School.
Ownership History
Date
Name
Owned For
Owner Type
Purchase Details
Closed on
Nov 12, 2021
Sold by
Ace Homes Llc
Bought by
Yamasa Co Ltd
Current Estimated Value
Purchase Details
Closed on
Sep 7, 2021
Sold by
Corbett Charles H
Bought by
Ace Homes Llc
Purchase Details
Closed on
May 22, 2006
Sold by
Wagner David J and Wagner Erin D
Bought by
Corbett Charles H
Home Financials for this Owner
Home Financials are based on the most recent Mortgage that was taken out on this home.
Original Mortgage
$128,976
Interest Rate
6.44%
Mortgage Type
New Conventional
Purchase Details
Closed on
Sep 2, 2005
Sold by
Wagner David J
Bought by
Wagner David J and Wagner Erin D
Home Financials for this Owner
Home Financials are based on the most recent Mortgage that was taken out on this home.
Original Mortgage
$96,000
Interest Rate
5.88%
Mortgage Type
New Conventional
Purchase Details
Closed on
Feb 28, 1997
Sold by
Glaze Kenneth Kim
Bought by
Wagner David
Create a Home Valuation Report for This Property
The Home Valuation Report is an in-depth analysis detailing your home's value as well as a comparison with similar homes in the area
Home Values in the Area
Average Home Value in this Area
Purchase History
| Date | Buyer | Sale Price | Title Company |
|---|---|---|---|
| Yamasa Co Ltd | $235,000 | -- | |
| Ace Homes Llc | $160,500 | -- | |
| Corbett Charles H | $131,000 | -- | |
| Wagner David J | -- | -- | |
| Wagner David | $9,800 | -- |
Source: Public Records
Mortgage History
| Date | Status | Borrower | Loan Amount |
|---|---|---|---|
| Previous Owner | Corbett Charles H | $128,976 | |
| Previous Owner | Wagner David J | $96,000 | |
| Closed | Wagner David | $0 |
Source: Public Records
Tax History Compared to Growth
Tax History
| Year | Tax Paid | Tax Assessment Tax Assessment Total Assessment is a certain percentage of the fair market value that is determined by local assessors to be the total taxable value of land and additions on the property. | Land | Improvement |
|---|---|---|---|---|
| 2024 | $4,466 | $111,880 | $18,480 | $93,400 |
| 2023 | $3,614 | $87,600 | $12,800 | $74,800 |
| 2022 | $3,019 | $72,600 | $12,800 | $59,800 |
| 2021 | $1,184 | $53,200 | $8,960 | $44,240 |
| 2020 | $1,022 | $48,280 | $8,600 | $39,680 |
| 2019 | $530 | $31,480 | $4,680 | $26,800 |
| 2018 | $533 | $31,480 | $4,680 | $26,800 |
| 2017 | $431 | $28,000 | $4,680 | $23,320 |
| 2016 | $400 | $28,000 | $4,680 | $23,320 |
| 2015 | $502 | $31,480 | $4,680 | $26,800 |
| 2014 | $497 | $33,120 | $3,960 | $29,160 |
| 2013 | -- | $31,640 | $4,840 | $26,800 |
Source: Public Records
Map
Nearby Homes
- 2923 Raintree Dr SE
- 2924 Raintree Dr SE
- 820 Bridgewater Way SE
- 1813 Holmsey Cir
- 812 Raintree Way SE
- 917 Curry Cir SE
- 693 Deering Rd SE
- 726 Shoreline Trail SE
- 3014 Lakeridge Dr SE
- 665 Huron Ct SE
- 3021 Lakeridge Dr SE
- 3027 Lakeridge Dr SE
- 2987 Landmark Dr SE
- 1920 Logan Ln
- 574 Almand Branch Rd SE Unit 1
- 549 Greenview Ave SE
- 832 Virginia Ct SE
- 1115 Fountain Crest Dr
- 3165 Goode Rd
- 2717 Stanton Woods Dr SE
- 780 Bridgewater Way SE Unit 213
- 780 Bridgewater Way SE
- 780 Bridgewater Way SE Unit L2
- 800 Bridgewater Way SE
- 0 Bridgewater Way SE Unit 7625613
- 0 Bridgewater Way SE Unit 7118324
- 0 Bridgewater Way SE Unit 7094716
- 0 Bridgewater Way SE Unit 2835491
- 0 Bridgewater Way SE Unit 7009426
- 0 Bridgewater Way SE Unit 8280361
- 0 Bridgewater Way SE
- 785 Bridgewater Way SE
- 804 Bridgewater Way SE Unit 41
- 804 Bridgewater Way SE Unit 804
- 770 Bridgewater Way SE
- 766 Shoreline Trail SE
- 775 Bridgewater Way SE
- 805 Bridgewater Way SE
- 812 Bridgewater Way SE
- 790 Lucerne Ave SE